Figure 5.

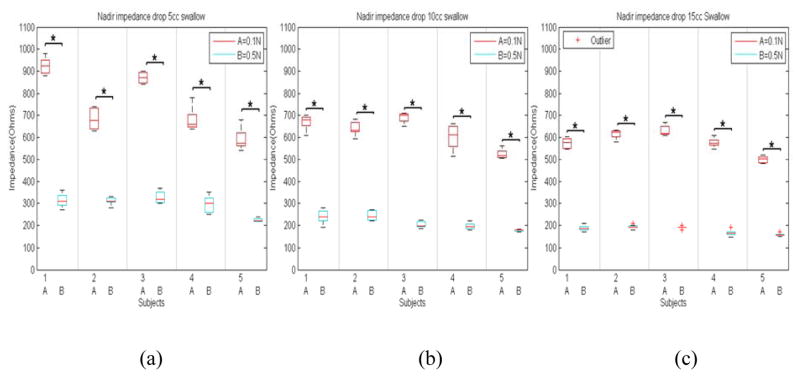
(a) Boxplot of nadir impedance values with swallowed boluses of two saline concentration swallow with (a) 5cc, (b) 10cc, and (c) 15cc in each of the five subjects (*p<0.05, A denoting 0.1N and B 0.5N saline concentrations).

(a) Boxplot of nadir impedance values with swallowed boluses of two saline concentration swallow with (a) 5cc, (b) 10cc, and (c) 15cc in each of the five subjects (*p<0.05, A denoting 0.1N and B 0.5N saline concentrations).