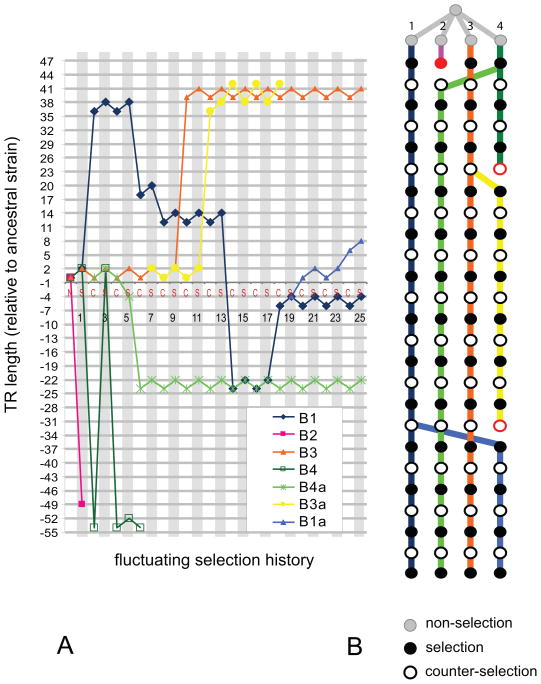
Figure 2. Evolutionary trajectories of the B-lineages.
(A) Evolutionary trajectory of the B-lineages. The horizontal axis represents passages, and the vertical axis represents TR length (in bp) relative to the ancestral genotype. The horizontal gray lines correspond to in-frame TR lengths, and the vertical gray strips correspond to the selective environment.
(B) Lineage representation of the B-lineages. The color of each lineage corresponds to the color in (A). Gray, black, and white nodes represent non-selective, selective, and counter-selective environments. Nodes shown in red are the last node in each lineage, followed by extinction events.

