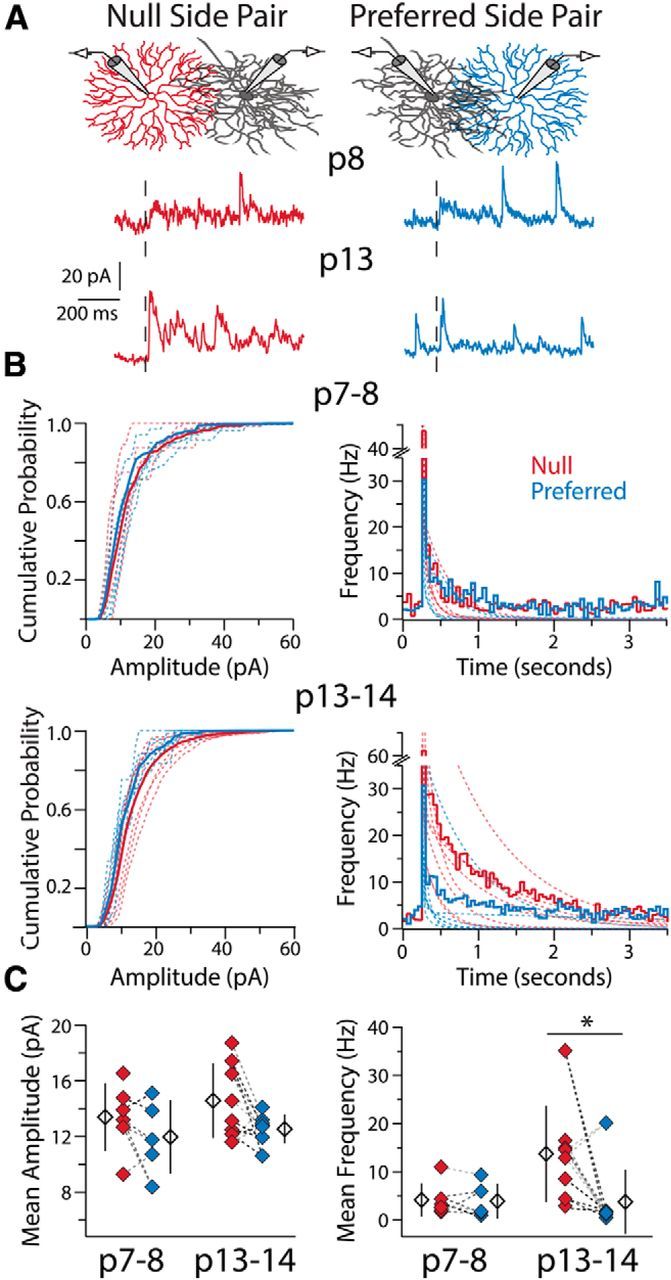
Figure 2.

Presynaptic mechanisms underlie the changes in SAC-DSGC connectivity during development. A, Example recordings in Sr2+-ACSF from two DSGCs at different ages upon stimulation (black dashed line) of a null- and a preferred-side SAC connected to each DSGC. Stimulation of the null-side SAC at P13 produces a greater frequency of a-mIPSCs. B, Average cumulative probability distributions of a-mIPSC amplitudes (left) and average peristimulus frequency histograms (right) for null and preferred-side pairs at P7–P8 (top) and P13–P14 (bottom). Dashed lines are cumulative probability distributions of a-mIPSC amplitudes or double-exponential fits to frequency histograms (as per Fig. 1C) for individual pairs. C, Mean a-mIPSC amplitude (left) and mean a-mIPSC frequency (right; see Materials and Methods) for each SAC-DSGC pair. Amplitude and frequency measures recorded in the same DSGC for preferred- and null-side pairs are connected via dashed lines of the same color. Average a-mIPSC amplitudes are not significantly different between groups (one-way ANOVA, p = 0.18, df = 26), whereas a-mIPSC frequency is significantly different at P13–P14, but not P7–P8, between null- and preferred-side pairs (Kruskal–Wallis one-way ANOVA, p = 0.006, df = 3; Dunn-Holland-Wolfe post hoc, p = 0.007; Null P13–P14 vs Pref P13–P14). Note, the one preferred-side SAC-DSGC pair with a high a-mIPSC frequency was the only SAC-DSGC pair in this study with an intersoma distance of <50 μm (see Discussion). Open diamonds are population averages, error bars show SD, and asterisk highlights significant difference between groups for this and all subsequent figures.
