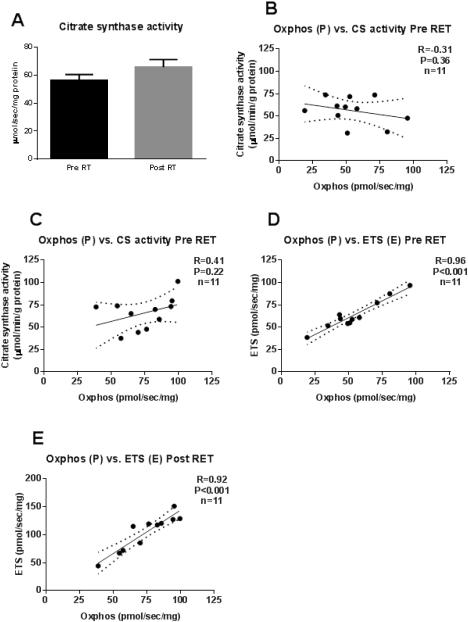
Figure 2. Skeletal muscle respiratory capacity.
Skeletal muscle citrate synthase activity (Panel 2A) before (black bars) and after (grey bars) resistance exercise training. There was no correlation between citrate synthase (CS) and PI+II before (Panel 2B) or after (Panel 2C) RET. There was a significant correlation between PI+IIand E before (Panel 2D) and after (Panel 2E) RET.

