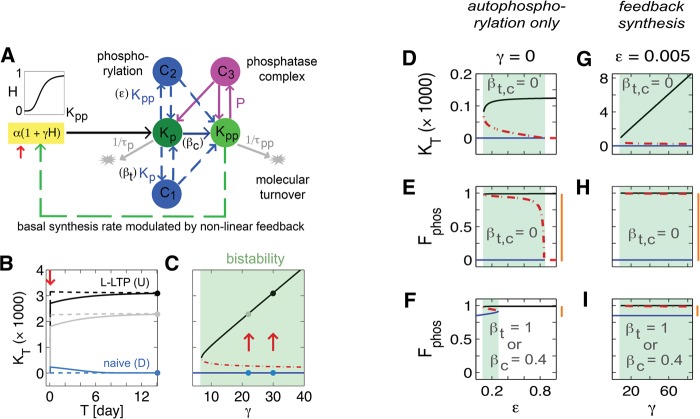
Figure 1.
Model of a molecular switch based on bistable aPKC dynamics. (A) Schematic diagram illustrates that the (hybrid) model has two forms of self-regulation: autophosphorylation (blue dashed arrows) and nonlinear modulation of protein synthesis (green arrow). Kp and Kpp are singly and doubly phosphorylated kinase with molecular turnover times, τp and τpp. C1, C2 and C3 are complexes resulting from binding of Kp with Kp, Kp with Kpp, and Kpp with free phosphatase P. α and γα are synthesis rates of Kp during pre- and post-potentiation; ɛ and βt are control parameters for feedback and feedforward (trans)autophosphorylation; βc controls rate of (cis)autophosphorylation or external kinase activity. H is a Hill function of order 4 used for nonlinear modulation of protein synthesis. Red arrows in panels B and C indicate the induction protocol: 15 min of elevated synthesis rates in the range 2–3.5 units sec−1. (B) Time evolution of total amount of the kinase, KT, with or without induction for γ = 22 (gray) and 30 (black). U and D indicate potentiated synaptic state or L-LTP and naïve or prepotentiated synaptic state, respectively. Solid lines result from a weaker induction protocol than dashed lines. Circles indicate equilibria achieved over time. (C) Bifurcation diagram showing dependence of equilibria on γ. Blue and black curves are composed of equilibria of type D and U. Circles indicate particular cases in panel B. Red dashed curve represents threshold or unstable equilibria. Green-shaded box indicates region of bistability (“molecular switch”). (D) Equilibria in terms of total kinase, KT, with respect to control parameter, ɛ, of feedback autophosphorylation when activity-dependent protein synthesis and other forms of phosphorylation are eliminated, γ = 0 and βt,c = 0. In all panels, shaded regions indicate bistability, blue lines are D states, black lines are U states, and red dashed lines are thresholds for switching between the two states. (E) For the same parameters as in panel D, equilibria in terms of fraction of phosphorylation, Fphos, is plotted. When present, vertical orange bars in all panels indicate change due to stimulation. (F) Same as panel E except βt = 1 or βc = 0.4. (G) Same type of plot as panel D, but ɛ is fixed at a value below the shaded region in panel D and γ is varied. (H) Same type of plot as panel E but parameters are as in panel G. (I) Same as panel E except βt = 1 or βc = 0.4.

