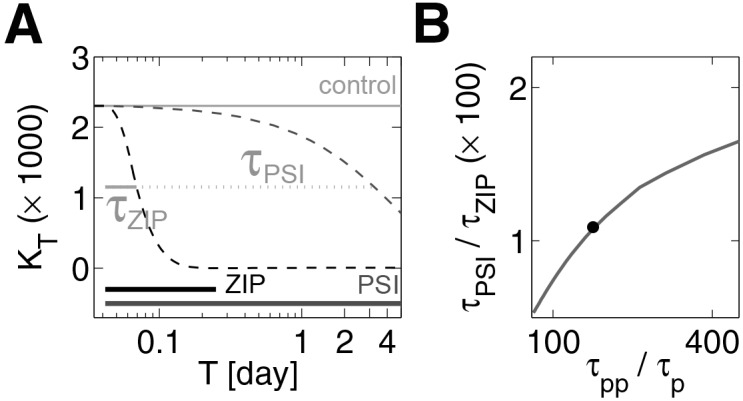
Figure 3.

Both activity and protein synthesis inhibitors can reverse L-LTP but over different time scales. (A) Time evolution, on semi-log scale, of potentiated state with inhibitors. Gray line (control) indicates previously potentiated synaptic state. Blue dashed line (PSI outcome) indicates effect of PSI. Black dashed line (ZIP outcome) indicates effect of ZIP. Thick horizontal lines indicate durations of ZIP (black) and PSI (blue) application. Level of orange line indicates amount used to estimate exponential decay constants due to ZIP and PSI, τPSI (dotted plus solid line length) and τZIP (solid line length). (B) Ratio of decay times due to inhibitors plotted against synaptic lifetimes of each kinase form. Solid dot corresponds to the case in A.
