Figure 5.

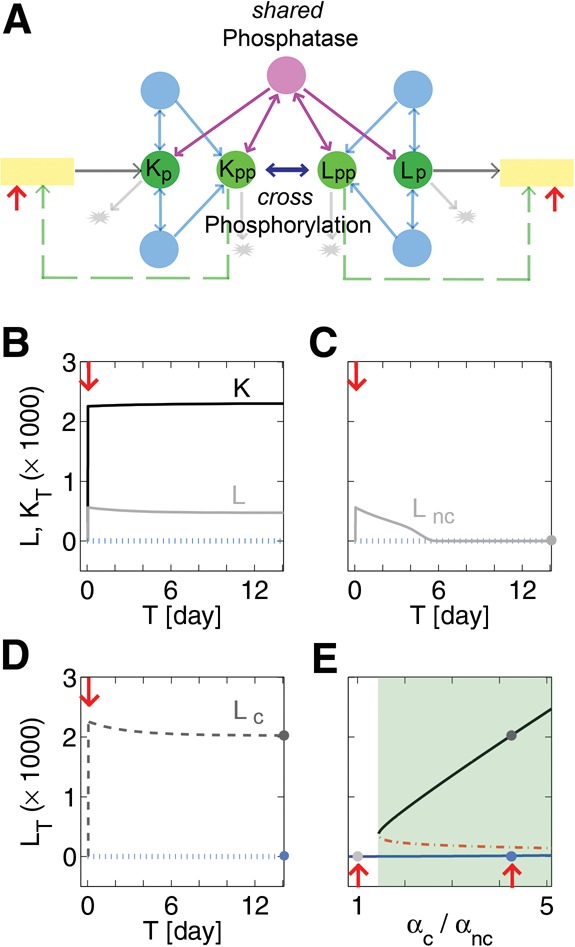
Two-kinase model with or without compensation. (A) Schematic diagram of the model. For simplicity each molecular species is color-coded as Figure 1A and additional complexes are not visible; the two forms of interactions between the kinases are symbolically shown. Details are in Materials and Methods. (B) Black curve labeled K is the potentiated level for the stronger kinase, which has higher levels of activity-dependent synthesis and autophosphorylation, than does the weaker kinase L (for which the lower gray curve indicates its potentiated level). Blue dotted line indicates virtually identical amounts of K and L in the naïve state. Red arrows in all panels indicate induction as mentioned previously. Circles indicate equilibrium achieved over time in all panels. (C) Gray line indicates kinase L that receives the same induction as in panel A but in the absence of kinase K. Blue dotted line indicates level of L in the naïve state. (D) Dark gray dashed line indicates kinase L after potentiation when compensation in the form of increased basal synthesis of L is taken into account. Blue dotted line indicates naïve state. (E) Compensatory rate of basal synthesis of L, αc, is varied compared with the noncompensatory rate αnc. Blue curve is composed of naïve states, dark gray curve is composed of potentiated states, and red dashed curve is the threshold. Circles indicate cases in panels C and D.
