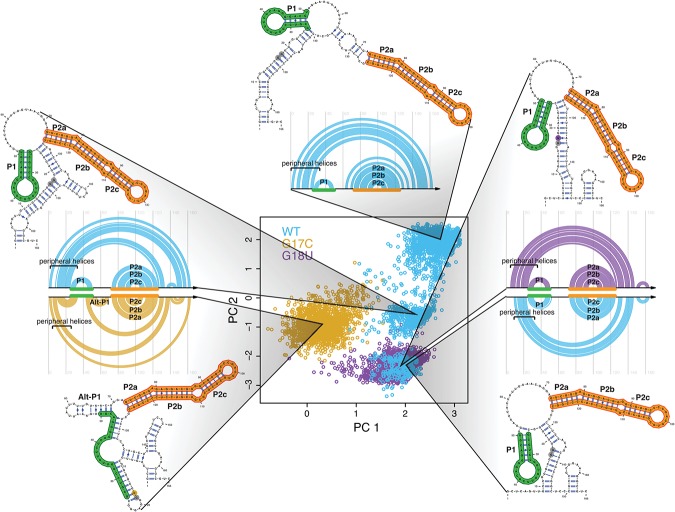
FIGURE 2.
Mutations collapse the structural space of the RB1 5′ UTR. (Center) Principal component decomposition of Boltzmann sampled suboptimal structures using SHAPE-directed free energy calculations (Deigan et al. 2009; Wilkinson et al. 2009). Representative structures are plotted next to the principal component space with their corresponding arc diagram. WT (blue) adopts three distinct conformations, while G17C (gold) adopts one cluster distinctly different from any WT structure. G18U (purple) adopts one major conformation that overlaps with one of the three WT structures, indicating that both sequences contain the same class of structures, seen in the arc diagrams (right). Positions 17 and 18 are denoted in gray when not mutated and in color when mutated. All structures include a major paired region (P2abc; orange). The WT and G18U conformations all contain another paired region (P1; green), while G17C favors an alternative P1 (Alt-P1) helix.

