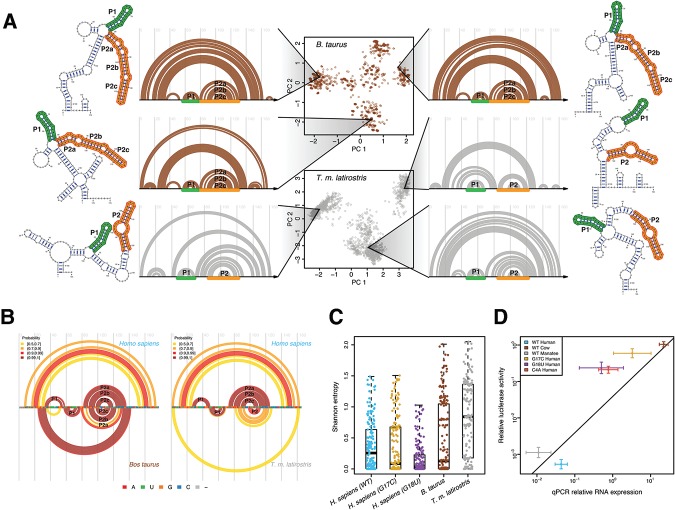
FIGURE 5.
Multiple divergent conformations are a conserved feature of the cow and manatee RB1 5′ UTRs. (A) (Center) Principal component decomposition of SHAPE-directed Boltzmann suboptimal sampling for the B. taurus (brown) and T.m. latirostris (gray) RB1 5′ UTRs. Both these RNAs display multiple well-populated conformations. Representative structures are plotted next to their corresponding arc diagrams. The P1 and P2 stem structures, analogous to those observed in human, are annotated with green and orange, respectively. (B) Arc diagrams of high-probability base pairs for the B. taurus (left) and T.m. latirostris (gray) compared with high-probability base pairs in H. sapiens. The P1 and P2 stem structures are consistent with the predicted structural similarity of these sequences. (C) Shannon entropy for each base using SHAPE-directed prediction of the partition function. The WT human, cow, and manatee UTRs have the highest median entropies, consistent with these UTRs forming multiple structures, while the two disease-associated UTRs have lower Shannon entropy. (D) Scatter plot of luciferase activity (y-axis) versus luciferase RNA abundance (x-axis) for the human, cow, and manatee WT constructs (blue, brown, and gray, respectively) and the three human mutant UTRs (C4A, G17C, G18U; red, gold, and purple, respectively). Values reported for both luciferase activity and RNA abundance are relative to an empty vector control. In general, higher RNA transcription yields higher luciferase activity, as expected. Also plotted is the linear regression through the three WT constructs (human, manatee, and cow). The three mutant constructs have slightly higher expression than WT as they all decrease above this line; however, the largest regulatory effects of UTR variation are at the level of RNA.

