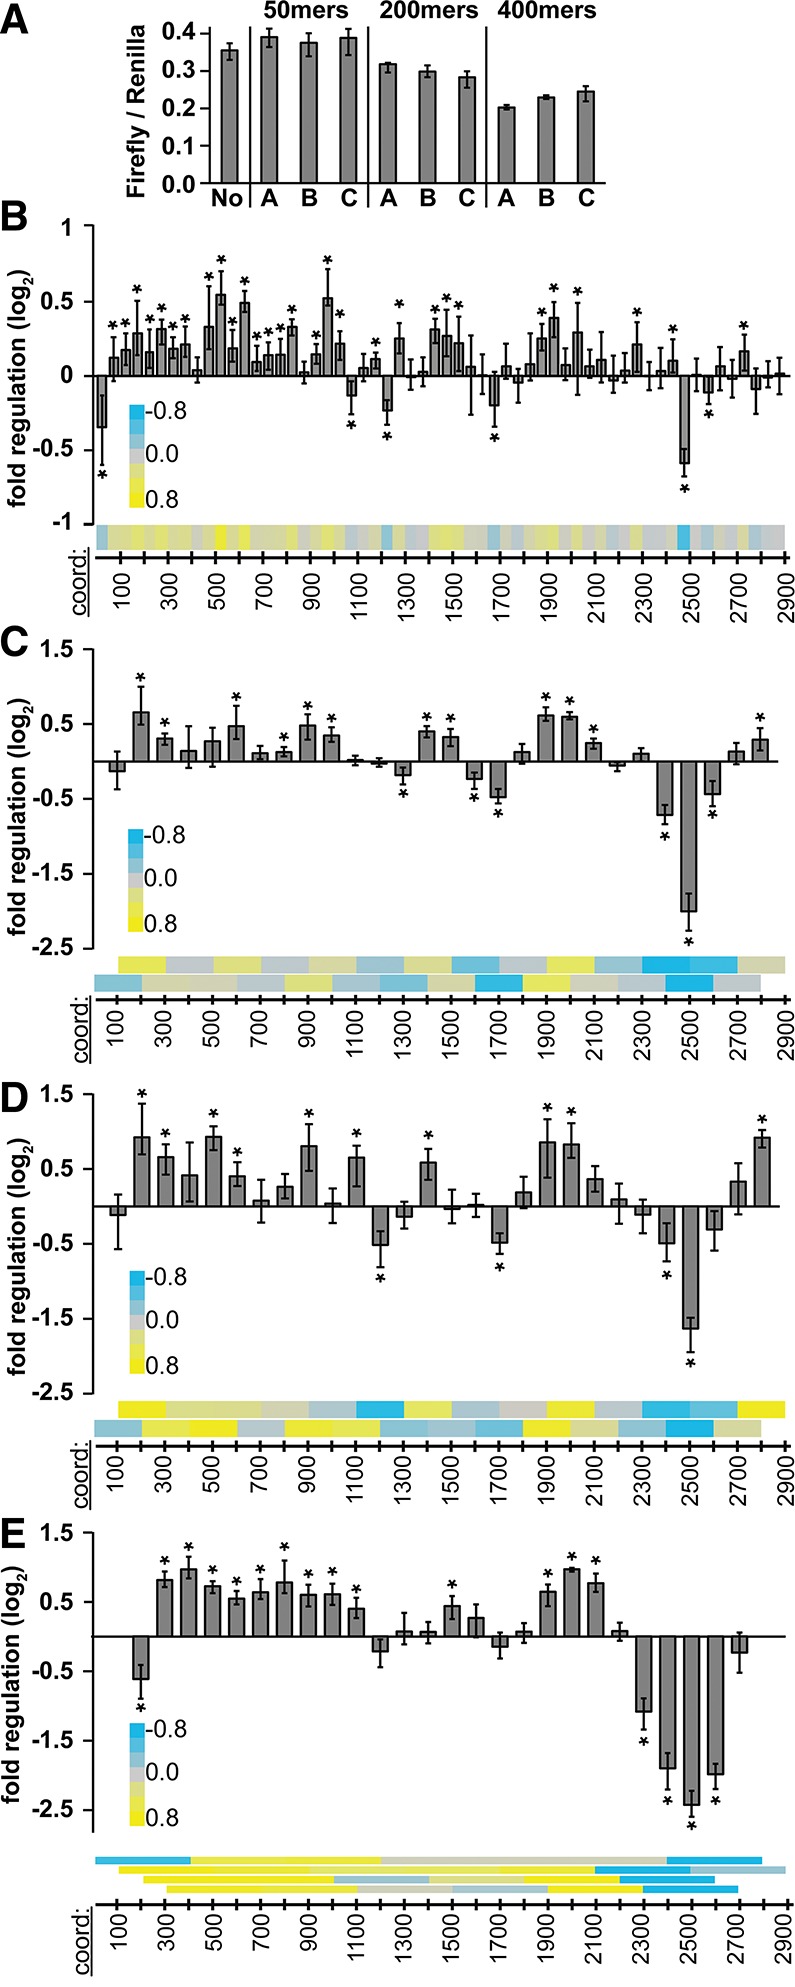
FIGURE 2.

Regulatory sequences in the mouse Hmga2 3′ UTR at different size resolutions. (A) Reporter assays measuring regulatory impact of 50-, 200-, and 400-nt (n = 9) 3′-UTR fragments of random sequence, otherwise as described in Figure 1B. (B–E) Reporter assays measuring regulatory impact of tiled 50mer fragments (n > 12) of mouse Hmga2 3′-UTR sequences (B); 200mer fragments tiled at 100-nt intervals (C,D, mouse and human sequences, respectively); and 400mer mouse 3′-UTR fragments tiled at 100-nt intervals (E). Heatmaps (bottom of each panel) show same data while illustrating tiling strategy (each bar is centered over the middle of the corresponding square in the heatmap). Significance of regulation determined with Bonferroni-corrected Wilcoxon rank-sum tests (n = 9; * indicates P < 0.05), otherwise as described in Figure 1A.
