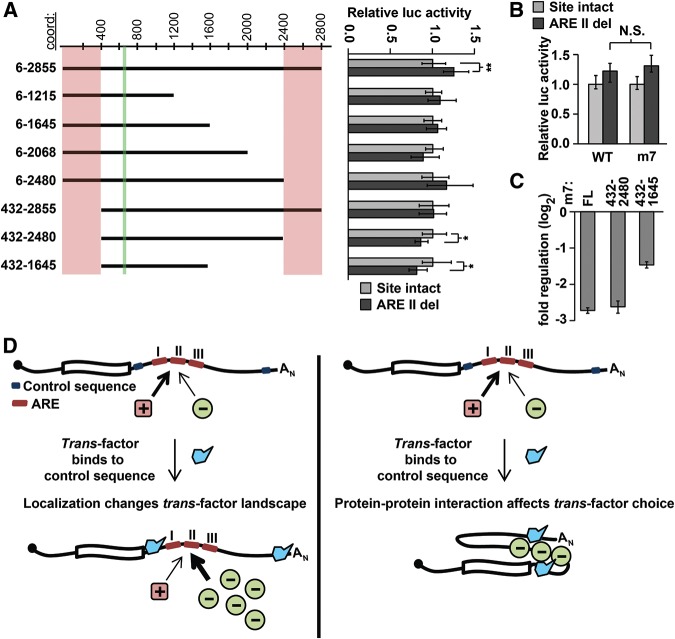
FIGURE 7.
Mapping regions involved in switching ARE function. (A) Truncation analysis reveals regions necessary for switching. The effect on reporter expression of ARE II deletion (shown on right) was determined in a set of truncation reporter constructs (illustrated on left with approximate coordinates shown at top). For each pair of truncation constructs, significant differences between otherwise wild-type and ARE II-delete reporters were determined with Wilcoxon rank-sum tests (n = 9; P < 0.05 and 1 × 10⁻³ indicated by * and **, respectively). The location of ARE II is marked in green and regions that affect ARE II function are marked in pink. (B) ARE II deletion has an equivalent effect on reporter expression in both a wild-type and a let-7-disrupted full-length Hmga2 reporter (Wilcoxon rank-sum tests; n = 9, P > 0.2). (C) Impact of terminal deletions on the overall regulatory effect of the Hmga2 3′ UTR. Full-length Hmga2 3′ UTR (m7) is compared with terminal truncation mutants (all constructs normalized to a no-3′ UTR control) (n = 9). (D) A model showing two possible mechanisms for the ARE II switching phenotype. On the left, a localization model depicts a trans-factor (in blue) binding to localization signals within the terminal regions, leading to a change in the transcripts local environment, thereby altering the set of trans-factors available to bind ARE II. On the right, a protein–protein interaction model depicts a trans-factor (in blue) interacting with sequences within the terminal regions of the 3′ UTR; binding of this factor governs the selection of regulatory proteins bound to ARE II.

