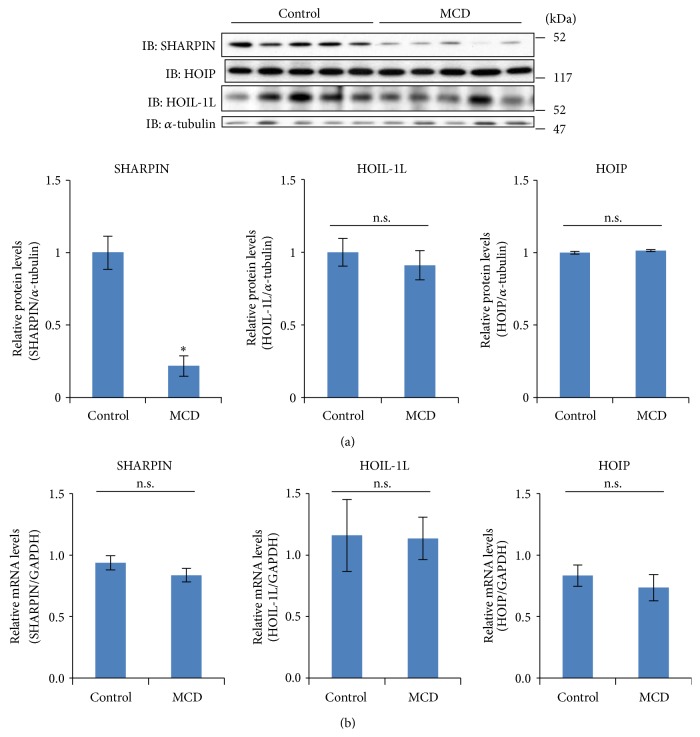
Figure 3.
(a) Eight-week-old mice were fed the control or the MCD diet for 8 weeks (n = 5 for each group). Their livers were homogenized in lysis buffer and cell lysates were separated by SDS-PAGE. Expressions of HOIP, HOIL-1L, and SHARPIN were determined by western blot using the corresponding antibodies. Each lane in the immunoblot corresponds to a different mouse. The quantitative SHARPIN/α-tubulin data are shown in the bar graph. Data are shown as means ± S.E.M. ∗ p < 0.05. (b) RNA was isolated from the livers and mRNA levels of SHARPIN, HOIL-1L, and HOIP were determined by real-time PCR using primers corresponding to their mRNA sequences (n = 5). The data were normalized with the expression of GAPDH mRNA.

