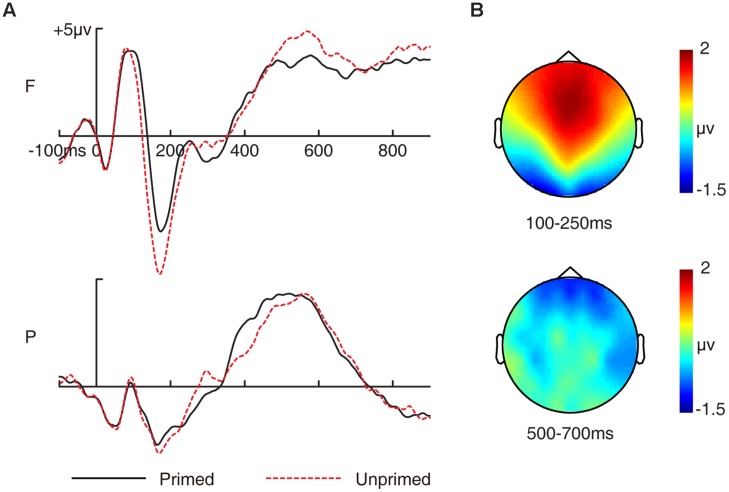
FIGURE 1.
Grand-averaged event-related potential (ERP) waveforms and topographic maps for priming effects in the study phase. (A) Grand-averaged ERP waveforms for primed and unprimed pictures in the study phase. (B) Topographic maps for the overall priming effects (ERPs to primed pictures minus ERPs to unprimed pictures) for 300–500 ms and 500–700 ms. F, frontal electrode cluster; P, parietal electrode cluster.

