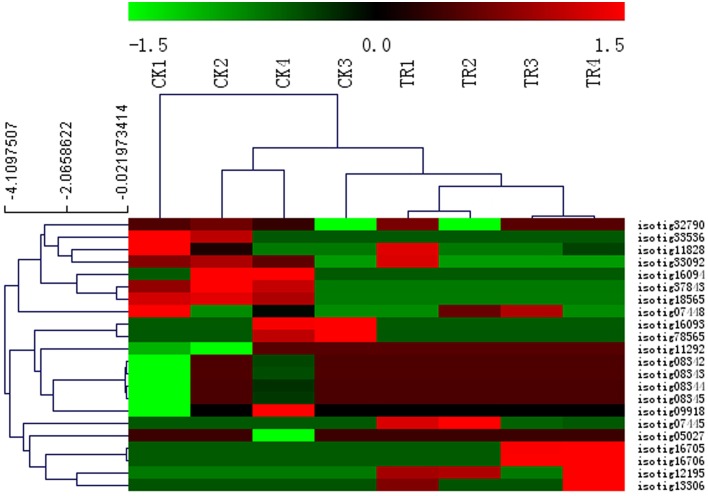
Figure 6.
Heat map showing the relative expression level for Metasequoia MADS-box genes in different stages during vegetative to reproductive phase transition based on DGE data analysis. The color scale (−1.5 to 1.5) represents the Z-score calculated by comparing Reads Per Kilobase of exon model per Million mapped reads (RPKM). Hierarchical clustering of genes and samples was shown in the dendrogram on the top and side of the heatmap using the complete linkage approach.

