Figure 1.

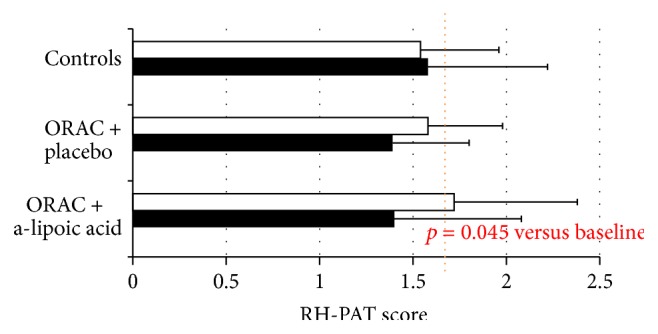
Endothelial function as RH-PAT score at baseline (■) and after 6-month follow-up (□); dotted line represents the normal value for the test.

Endothelial function as RH-PAT score at baseline (■) and after 6-month follow-up (□); dotted line represents the normal value for the test.