. 2014 Apr 9;8(2):186–196.
Copyright© Iranian Society of Medical Entomology & Tehran University of Medical Sciences
This work is licensed under a Creative Commons Attribution-NonCommercial 3.0 Unported License which allows users to read, copy, distribute and make derivative works for non-commercial purposes from the material, as long as the author of the original work is cited properly.
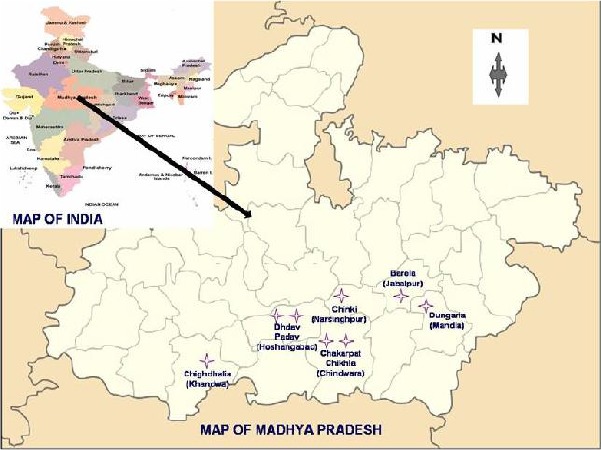
Fig. 1.

Map showing different collection sites in the study
