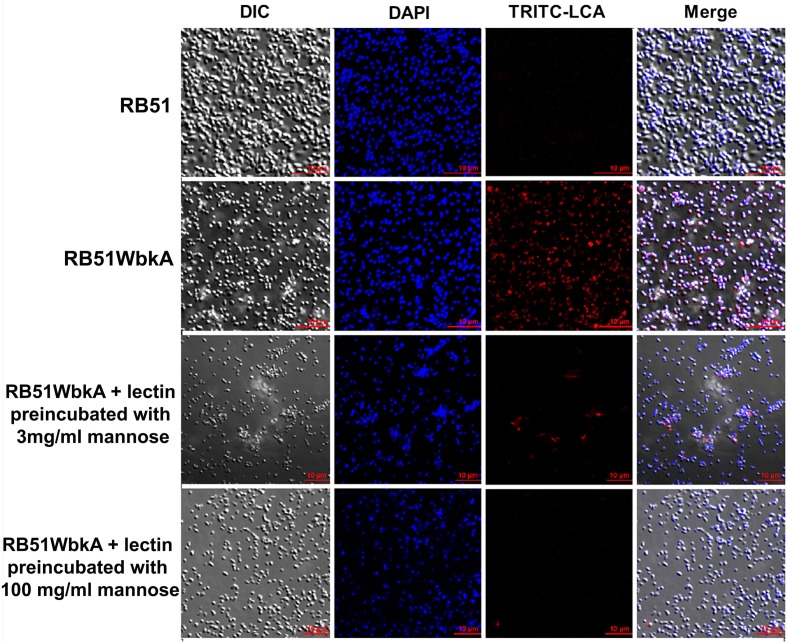
Figure 6.
Interactions between the fluorescently labeled LCA lectin and the strains RB51 and RB51WbkA are visualized using confocal laser scanning microscopy. The bacterial cells are stained with TRITC-labeled LCA lectin (red) in the absence of the target carbohydrate, or preincubated with 3 mg/ml mannose or 100 mg/ml mannose, prior to staining. DAPI (blue) was used to stain the bacterial nuclei. Selected differential interference contrast (DIC) images (left panel) and fluorescent images (middle panels) merged are shown (right panel). All images were acquired using the same settings and adjusted for display using the same brightness/contrast settings.

