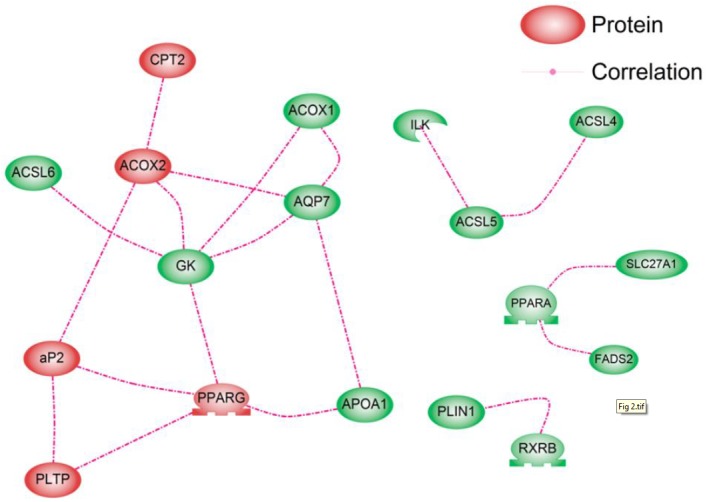
Figure 2.

Gene co-expression network of the 48 genes in the peroxisome proliferator-activated receptor pathway based on their expression values. To assess correlations, we calculated the Pearson’s correlation coefficient (r) between all gene pairs. Edges join genes with co-expression correlation (Pearson’s r) ≥0.65. The red members indicate significantly differentially expressed genes from the analysis of variance test.
