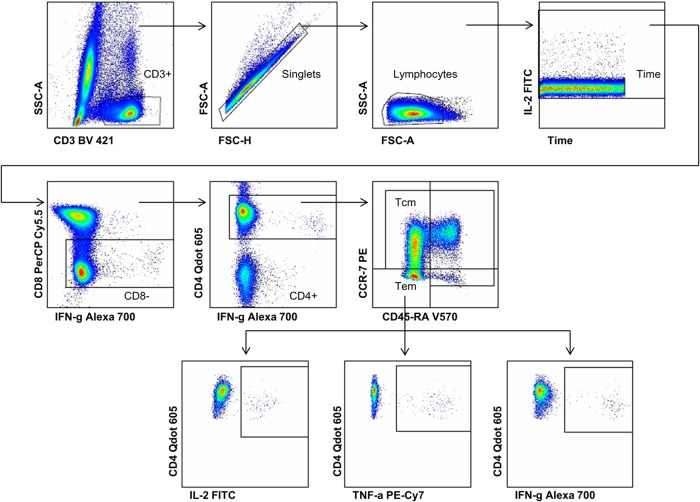
FIG 1.
Gating strategy used for flow cytometric analysis of H1-induced memory CD4+ T cell cytokine expression. The plots show the sequential gating hierarchy of one representative sample: CD3+ T cells; single cells; lymphocytes; time; and CD8+ T cells, which were further gated for CD4+ cells and split into all memory subsets on the basis of CCR7 and CD45RA surface markers. The bottom row comprises the plots with the cytokine expression gates for H1 fusion protein-stimulated TEM at day 182. IL-2, TNF-α, and IFN-γ expression levels were measured. TCM, central memory CD4+ T cells; TEM, effector memory CD4+ T cells; H1, hybrid 1.

