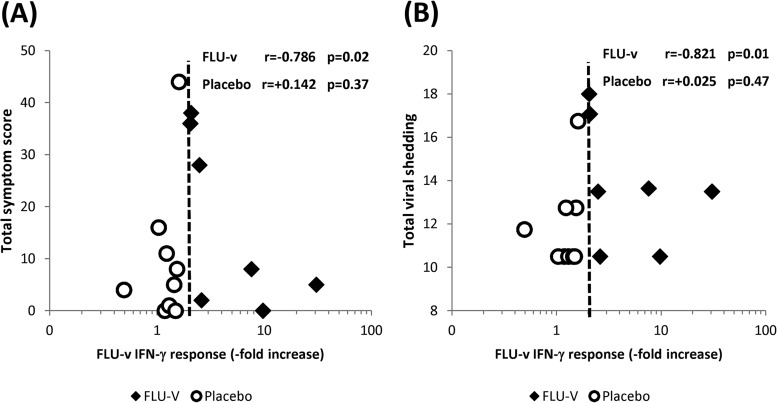
FIG 4.
Correlations between cellular IFN-γ responses and illness severity. Correlations between cellular IFN-γ responses specific to FLU-v prechallenge with A/Wisconsin/67/2005 (H3N2) and measurements of influenza severity postchallenge, i.e., symptom scores (A) and viral shedding (B). The magnitude of an individual's FLU-v-specific IFN-γ responses is represented as the fold increase in the response over the negative-control value. The dotted line represents the threshold point for a positive IFN-γ response to FLU-v (i.e., a ≥2-fold increase over the negative-control value). An individual's total symptom score represents the total sum of the daily scores (days 1 to 7 postchallenge). An individual's total viral shedding represents the total sum of daily viral shedding measurements by TCID50 (days 1 to 5 postchallenge). All of the analyses were carried out with the Spearman rank correlation test.

