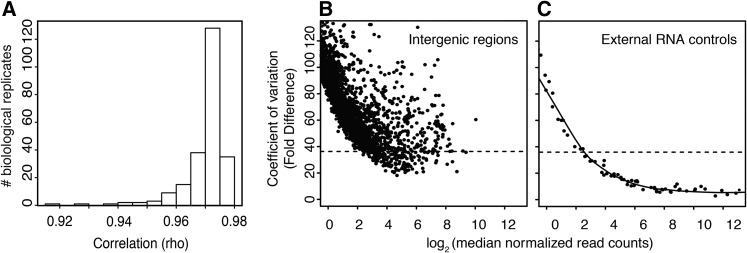
Figure 1.
RNA-Seq libraries and expression cut-offs. (A) Correlations among biological replicate RNA-seq experiments on adult heads. (B, C) Coefficients of variance (CV) for reads mapping to intergenic space (B) and spike-in RNA controls (C). Ninety-five percent of intergenic regions have a CV above the dotted line.

