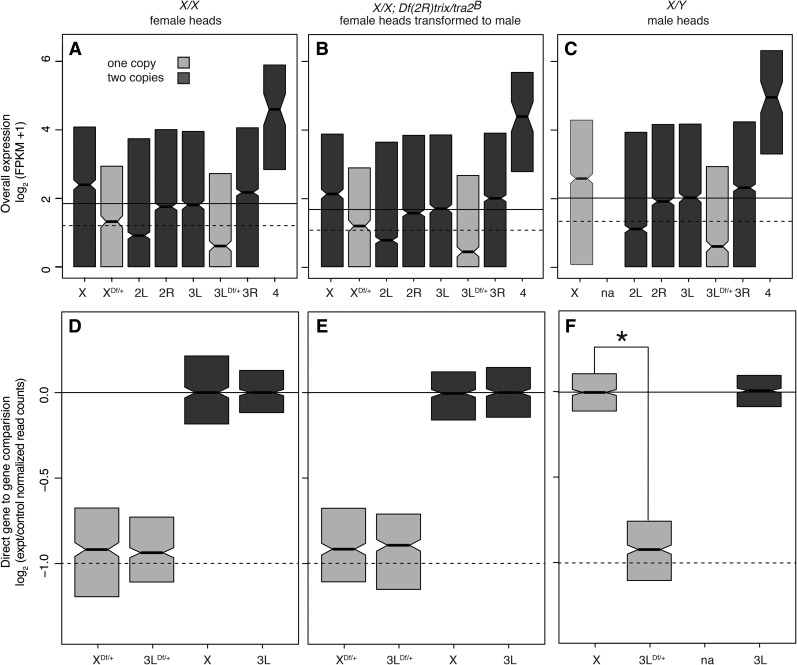
Figure 3.
Dosage response boxplots. (A–C) Head gene expression values by chromosome arm, including a separate category for Df/+ segments. (D–F) Ratiometric plots comparing the expression of genes in Df/+ segments to the same genes in +/+ (light). The controls (dark) were selected based on sampling the same number of genes as found in the experimental set. The +/+ genes from Df/+ flies were compared to the same +/+ genes from +/+ flies, or +/Y in the case of X-linked genes in XY males. (A, D) Females. (B, E) Females transformed into males. (C, F) Males. Plots show interquartile range (IQR; box), medians (bar), and confidence interval (±1.57 × IQR/√N).

