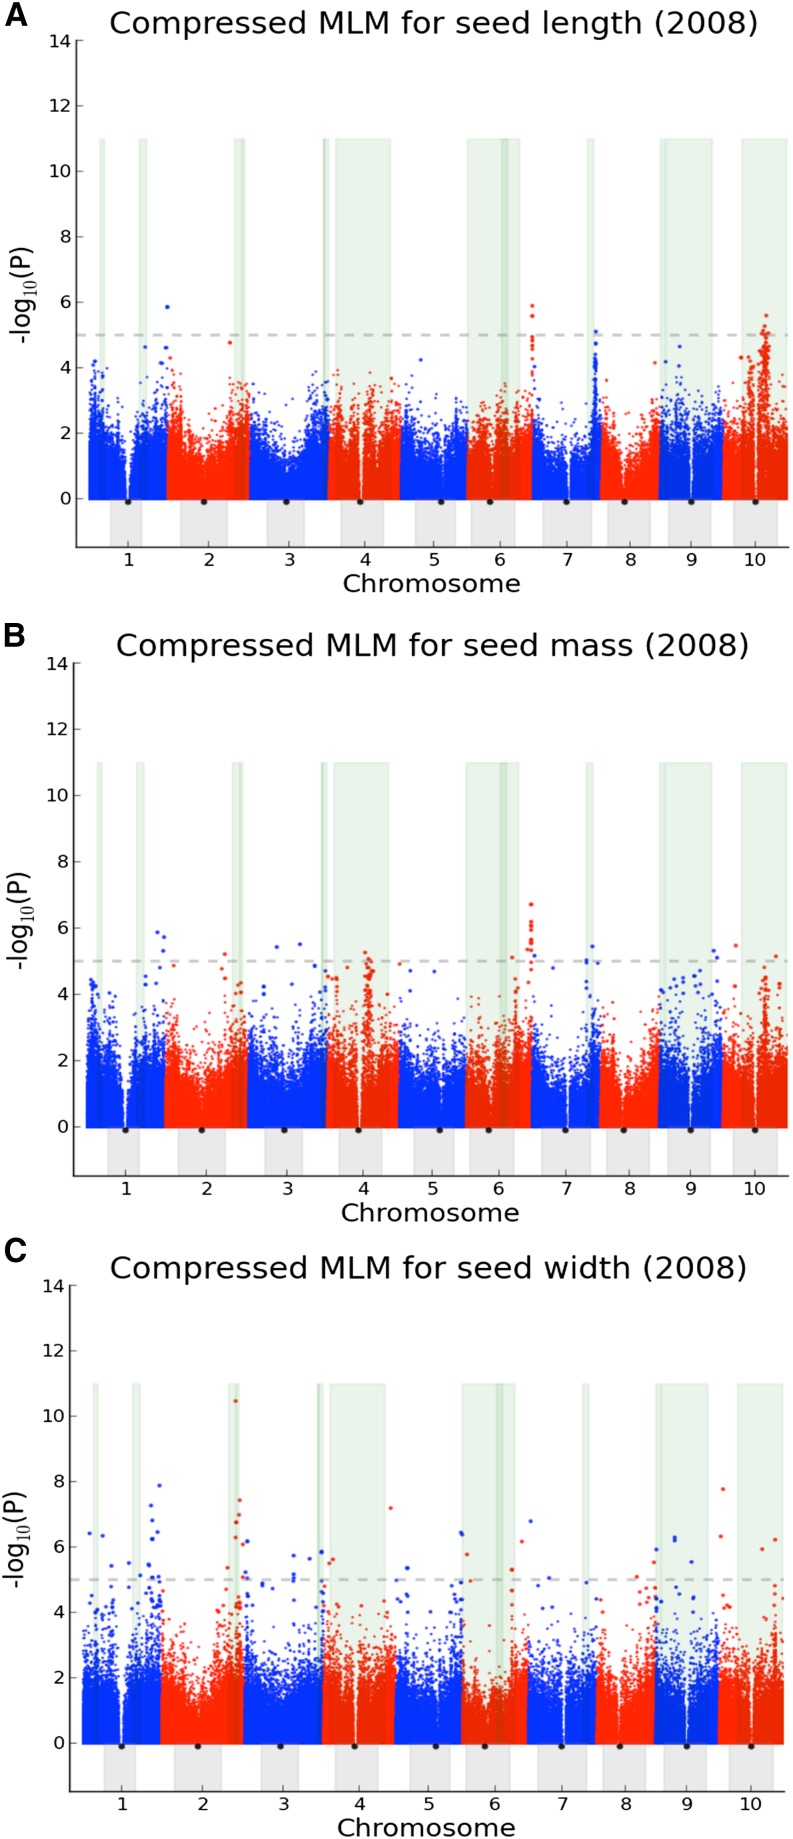
Figure 3.
Genome-wide association studies of seed length, seed mass, and seed width in 2008. (A) Manhattan plot of compressed mixed linear model (CMLM) (see Materials and Methods for details) for 2008 seed length. The 10 sorghum chromosomes are plotted against the negative base-10 logarithm of the association P value, with significance threshold denoted by the gray dashed line. The areas highlighted in green indicate likelihood intervals for seed size determined by QTL mapping. Heterochromatin and centromeres are indicated by the gray areas and black dots, respectively. (B) Manhattan plot of CMLM for 2008 seed mass. (C) Manhattan plot of CMLM for 2008 seed width.

