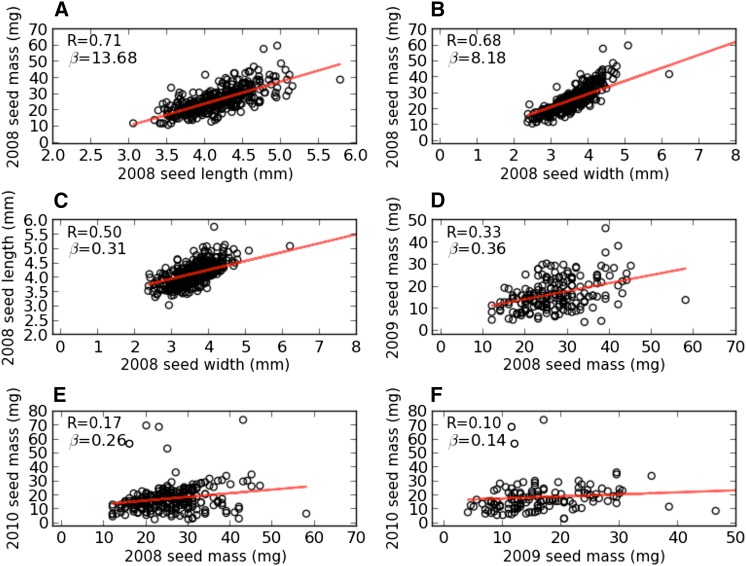
Figure 4.
Relationships among seed size–related traits from 354 accessions in a U.S. sorghum association panel (Casa et al. 2008). Red lines indicate linear regression resulting from least squares fitting, with Pearson correlation coefficients (R) and the slopes of the linear regression (β) shown. (A) The correlation between 2008 seed mass and 2008 seed length. (B) The correlation between 2008 seed mass and 2008 seed width. (C) The correlation between 2008 seed width and 2008 seed length. (D) The correlation between 2008 seed mass and 2009 seed mass. (E) The correlation between 2008 seed mass and 2010 seed mass. (F) The correlation between 2009 seed mass and 2010 seed mass.

