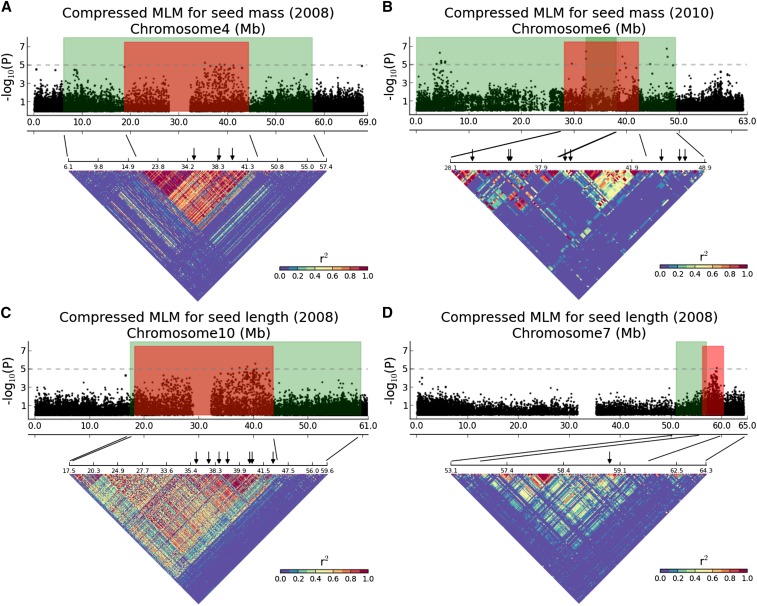
Figure 5.
Chromosome-wide Manhattan plots (top) for seed size traits. Green areas indicate likelihood intervals for seed size determined by QTL mapping. Red areas show hotspot for seed size identified by association mapping. Linkage disequilibrium (r2) matrices (bottom) are plotted for regions denoted by anchoring lines. Regions of strong LD are shown in red. Significant association markers are denoted by black arrows. (A) The 2008 seed mass associations on chromosome Sb04. (B) The 2010 seed mass associations on chromosome Sb06. Another association hotspot (chr Sb06: 2129372-5985416) is denoted in Table S3. (C) The 2008 seed length associations on chromosome Sb10. (D) The 2008 seed length associations on chromosome Sb07.

