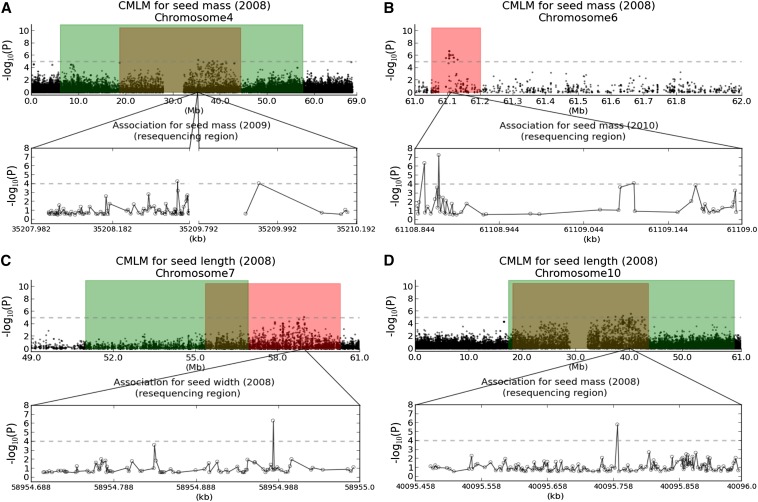
Figure 6.
Strength of association for seed size traits in targeted resequencing regions. Green areas indicate likelihood intervals for seed size determined by QTL mapping. Red areas show hotspot for seed size identified by association mapping. Four candidate genes [(A) Sb04g015420, (B) Sb06g033060, (C) Sb07g023950, and (D) Sb10g018720] encode six variants that are strongly associated (P ≤ 10−4) with sorghum seed size.

