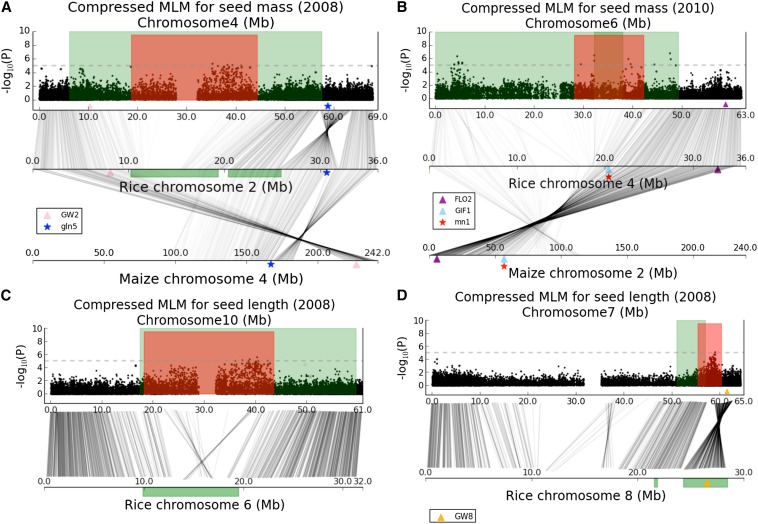
Figure 7.
Genetic correspondence across sorghum, rice, and maize. Genomic regions implicated in sorghum seed size by association (red) and QTL likelihood intervals (green) are shown. Genomic regions implicated in rice seed size by QTL studies are denoted by green areas. The known seed size genes in rice and maize are indicated by color-coded triangles and stars, respectively. Gray connecting lines indicate pairs of duplicated genes. (A) Genetic correspondence on sorghum chromosome Sb04, rice chromosome Os02, and maize chromosome Zm04. (B) Genetic correspondence on sorghum chromosome Sb06, rice chromosome Os04, and maize chromosome Zm02. (C) Genetic correspondence on sorghum chromosome Sb10 and rice chromosome Os06. (D) Genetic correspondence on sorghum chromosome Sb07 and rice chromosome Os08.

