
Figure 1.
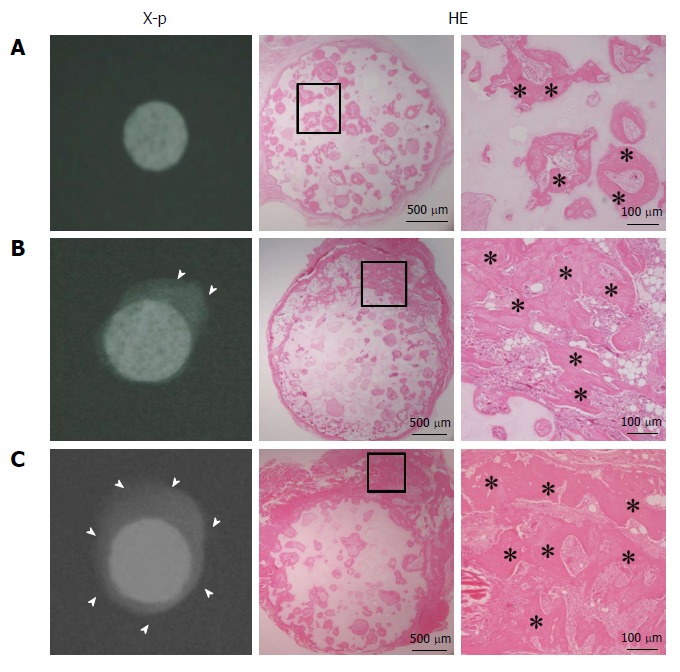
X-ray images and hematoxylin and eosin-stained sections at 4 wk post-implantation. A: BMSC/TCP constructs (C group); B: Sheet/TCP constructs (S group); C: BMSC/TCP/Sheet constructs (SC group). The S and SC groups showed abundant calcification around the TCP disk. Arrowheads indicate the area of calcification. Bone formation was observed histologically in the pores of the TCP disk in all groups. The S and SC groups showed bone formation on the surface of the disk. Higher magnification images of the boxed areas are shown at the right side of each panel. Asterisks indicate bone tissue. HE: Hematoxylin and eosin.