Abstract
A Monte Carlo treatment plan verification (MCTPV) system was developed for clinical treatment plan verification (TPV), especially for the conformal and intensity-modulated radiotherapy (IMRT) plans. In the MCTPV, the MCNPX code was used for particle transport through the accelerator head and the patient body. MCTPV has an interface with TiGRT planning system and reads the information which is needed for Monte Carlo calculation transferred in digital image communications in medicine-radiation therapy (DICOM-RT) format. In MCTPV several methods were applied in order to reduce the simulation time. The relative dose distribution of a clinical prostate conformal plan calculated by the MCTPV was compared with that of TiGRT planning system. The results showed well implementation of the beams configuration and patient information in this system. For quantitative evaluation of MCTPV a two-dimensional (2D) diode array (MapCHECK2) and gamma index analysis were used. The gamma passing rate (3%/3 mm) of an IMRT plan was found to be 98.5% for total beams. Also, comparison of the measured and Monte Carlo calculated doses at several points inside an inhomogeneous phantom for 6- and 18-MV photon beams showed a good agreement (within 1.5%). The accuracy and timing results of MCTPV showed that MCTPV could be used very efficiently for additional assessment of complicated plans such as IMRT plan.
Keywords: Intensity-modulated radiotherapy, monte carlo, Monte Carlo N-Particle extended, treatment plan verification
Introduction
Intensity-modulated radiotherapy (IMRT), an advanced technique of external radiotherapy, is a type of three-dimensional conformal radiotherapy (3D-CRT). Although IMRT has the potential to achieve better dose distributions conformed to the targets and normal tissue sparing, beam delivery is more complex in IMRT. This conformity of dose distribution is achieved through the superposition of a large number of small segments of radiation fields. Therefore, even small error in the dose calculation algorithm of the treatment planning systems could produce a large calculated-dose error. Moreover, this complexity together with inhomogeneities in the patient anatomy and several MLC effects such as the beam hardening[1] the leakage radiation,[2] and tongue-and-groove effect,[3,4] cause more errors in the doses computed by the conventional dose calculation algorithms.[5,6,7,8,9] Therefore, quality assurance of IMRT is critical for the verification of the radiation therapy planning system and patient-specific plans.[10] Patient-specific IMRT verification requires a quantitative evaluation of the dose distribution across the target and critical organs. Although, the 3D dosimetry is ideal to verify dose gradients for IMRT quality assurance, 3D dosimeters are not usually used due to their inconveniences.[11,12] Instead, two-dimensional (2D) dosimeters such as film or diode arrays are more often used. On the other hand, these measurement tools may have some important errors due to the limitations, such as low spatial resolution for 2D diode arrays and over response to low-energy photons and processor-dependent optical density values for the radiographic films.
Beside the measurement, Monte Carlo simulation could be used as an independent check of the IMRT dose distributions.[5] It is well-known that highly accurate and precise 3D dosimetry could be made using the Monte Carlo simulation. Therefore, several research groups have developed their own Monte Carlo treatment plan verification (MCTPV) systems for routine quality assurance of 3D conformal and IMRT plan in clinics based on the general-purpose Monte Carlo codes (such as EGSnrc,[13] BEAMnrc,[14] PENELOPE,[15] MCNP,[16] and GEANT[17]) or fast Monte Carlo code (such as XVMC,[18] VMC++,[19] DPM,[20] and MCDOSE[21]). These include an integrated system for Monte Carlo routine radiotherapy plan verification (MCRTV) built on the EGS4 Monte Carlo code,[22] a multiplatform software system developed by McGill radiotherapy research environment for patient-specific treatment planning (MMCTP) based on the BEAMnrc and XVMCcodes,[23] the Swiss Monte Carlo Plan (SMCP) developed at the University Hospital of Berne based on EGSnrc, VMC++, analytical anisotropic algorithm (AAA), and PIN which is interfaced with the Eclipse TPS,[24] the RTGRID distributed simulation environment for CRT based on BEAMnrc Monte Carlo code[25] and a web platform for the verification and optimization of radiation treatment plans (eIMRT) based on BEAMnrc Package.[26]
In this work, a MCTPV system was developed based on the MCNPX[27] code as a routine verification tool for radiotherapy treatment plans. MCNP being a general-purpose, continuous-energy, generalized-geometry, time-dependent, and Monte Carlo radiation transport code, has many applications in medical physics.[28,29,30,31] In contrast with EGSnrc and GEANT, MCNP does not require any programming by the user. Instead, the user only needs to provide an ASCII input file specifying the geometry and materials, the source, the tallies, and (optionally) the use of one or more of the many available variance reduction techniques. The simulation results are provided in ASCII output files. Therefore, developing an application for generating the input file and visualizing the output data is a relatively simple work.
In MCTPV, several techniques including merging cells with the same material, energy deposition mesh tally and hybrid parallel processing were implemented to reduce the simulation time. Among different versions of MCNP code (including MCNP4C,[16] MCNP5,[32] and MCNPX), the MCNPX was used because just this version has an energy deposition mesh-tally (type 3) which is suitable for dose calculation in partial body irradiation. MCNP4C does not have any mesh tally tool and MCNP5 only has mesh tally type 4 (the track length estimate of the particle flux), which could be converted to the absorbed dose using DE/DF cards. But this is only applicable for whole body irradiation not for partial body irradiation such as radiotherapy.[29] MCTPV has an interface with TiGRT planning system (TiGRT, LinaTech LLC, USA) and reads plan configurations needed for Monte Carlo dose calculations. In this paper, the main features of the MCTPV system are described in detail and MCTPV calculation results were also compared with that of TiGRT planning system and measurements. Also we have developed and commissioned the phase-space data of 6 and 18-MV photon beams of our Siemens ONCOR Impression accelerator by comparisons with the measurements under several conditions.
Materials and Methods
MCTPV was developed using MCNPX Monte Carlo code to simulate the radiation transport through the complex geometry of the linear accelerator treatment head and patient anatomy, which runs on an 80-core MOSIX (Linux) cluster. A graphical user interface (GUI) application was developed using C# programming language to make it more user friendly. MCTPV has an interface with a commercial TPS (TiGRT, LinaTech LLC, USA) and reads the required information for Monte Carlo calculation transferred by. RTP file and DICOM-RT format. The MCNPX input files created by GUI are run automatically on the cluster and the output files are then processed by the GUI for display and analysis.
Monte Carlo modeling: Linear accelerator modeling
The Monte Carlo models of the 6 and 18-MV photon beams from our Siemens ONCOR Impression accelerator and the 82-leaf OPTIFOCUS MLC were developed and implemented to MCTPV. For this purpose, the treatment head was divided into two regions; the patient-independent (including target, primary collimator, flattening filter, chamber, and mirror) and the patient-dependent portions (including jaws, MLC, etc.). To reduce the simulation time, phase-space data were scored on a plane just above the patient-dependent portion (above the Y-jaws) and then used as an input to the subsequent transport through the patient-dependent portion of the treatment head (including MLC) and patient/phantom. In this work, 1 × 10⁹ incident electrons were simulated for both energies and phase-space data was recorded. Therefore, once the phase-space data of a given accelerator is commissioned, it is not necessary to repeat the simulation of particle transport through the patient-independent portion of the treatment head for each patient. In this study, the incident electron energy and radial intensity spread were modeled as Gaussian distributions.
The complex geometry and material of the target, primary collimator, flattening filter, chamber, mirror, MLC, Y-jaws, and wedges were incorporated into the model in great details based on the machine drawings and material tables provided by the manufacturer. However, precise values of some parameter such as energy and spatial distribution of incident electrons, shape, and thickness of the flattening filter were estimated using the trial and error method by comparing simulated and measured percentage depth doses and lateral profiles in water.
The Monte Carlo model of the Y-jaws, Siemens 82-leaf OPTIFOCUS MLC, and wedge were developed with MCNPX code as a part of the patient-dependent portion. This code is added to the patient geometry code using the GUI application and radiation transport of these two portions is simulated together. MCTPV is capable of simulating the conformal and IMRT fields. The positions of the leaves are read from an. RTP file created by TiGRT planning system.
Monte Carlo modeling: CT-based patient modeling
One of the significant features of the GUI application of MCTPV is its ability to convert computed tomography (CT) data of patient to the voxelized model in the MCNP input format, that is, cells, surfaces, materials, and densities. At first, CT data of patient are converted to the materials. Converting the CT number to material in MCTPV is similar to the procedure published by Schneider in Physics in Medicine and Biology (PMB) 2000.[33] The only exception is that, in MCTPV, five materials including adipose, soft tissue, bone tissue, lung tissue, and air are used in which the tissue compositions are taken from the International Commission on Radiation Units and Measurements (ICRU) reports.[34,35] When the tissue type is determined for each voxel, the CT data are then converted to the mass density using the CT conversion curve, which is defined as the ratio of the mass density to the CT number for each tissue. Table 1 shows material compositions.
Table 1.
Material composition taken from International Commission on Radiation Units and Measurements (ICRU) reports 46 (1992) and 44 (1989)
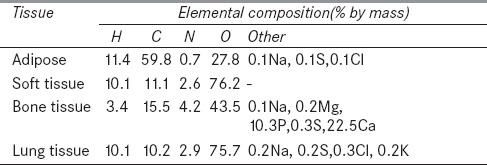
The imported CT files are first checked by GUI application to ensure that they contain valid 3D dataset. By default, 4 × 4 pixels (mesh grid size) are used to make a single voxel. But mesh grid size could be changed by the GUI application. Appropriate selection of grid space size is very critical and can be used for balancing between the accuracy and computational time. In fact each grid cell becomes an MCNP cell (voxel) bounded by planes defined by the grid. Accordingly, the absolute position of the voxel is determined from the image position and pixel spacing elements which is read from DICOM files. Then an algorithm is used to assign the material and density to each grid cell. The fraction of each material in the grid cell is computed from the relative number of pixels in each division range (five materials). Materials with fractions below an adjustable threshold are discarded and the remaining material fractions are then renormalized. The material density of the grid cell is then calculated from the fraction weighted of the constituent material densities and is saved in a 3D matrix (material density matrix) for dose scoring in the next step. In the last step a cell merging algorithm is used to merge neighboring cells with the same material. Two cells are merged if they share a common boundary and are composed from the same material. It is clear that, this process does not decrease accuracy because dose scoring is carried out using mesh tally. It should be mentioned that all of other input card such as the source data and the geometry and material of patient-dependent portion of the treatment head, are integrated into a single input file by the GUI application.
Parallel processing using MOSIX cluster: Hardware and software specifications
In our lab we set up a 5-node high performance computing (HPC) cluster which is a distributed memory system with symmetrical multiprocessor (SMP) nodes cluster type. Each node is equipped with four AMD quad core processors (totally 80 cores) at 2 GHz and 32 GB RAM. All nodes are connected via a Gigabit switch. The operating system Red Hat Enterprise 5.2 was installed on all nodes. We used GNU compiler collection (GCC) to compile MCNPX-V2.4 and Parallel Virtual Machine (PVM) 3.4.4 package for parallelizing the code. In addition, MOSIX 2.24.2.3 was installed on the cluster. MOSIX is a software package that extends the Linux kernel with cluster computing capabilities.[36] The enhanced Linux kernel allows any cluster size of Intel-based computers to work together like a single system, very much like a SMP system. MOSIX operates silently, and its operations are transparent to user applications. Users run applications sequentially or in parallel just like they would do on a SMP. Users neither need to know where their processes are running, nor be concerned with what other users are doing at the time. After a new process is created, MOSIX attempts to assign it to the best available node at that time. MOSIX continues to monitor all running processes. In order to maximize overall cluster performance, MOSIX will automatically move processes amongst the cluster nodes when the load is unbalanced. This is all accomplished without changing the Linux interface.[37]
Parallel running schema
To run a code with multitasking capability, usually the maximum number of tasks is selected equal to the number of central processing unit (CPU) cores. In some cases when the number of tasks increases, speedup factor increases as well. Speedup factor is defined as:

In the PVM or MPI version of MCNPX, when the number of cells is low, the number of tasks could be selected equal to the number of CPU cores. For this case the speedup factor could be as high as the number of tasks. However, in complex geometry such as CT-based Monte Carlo treatment planning in which the number of cells is very high, the speedup factor does not increase proportionally. In practice after a certain number of tasks the speedup factor becomes saturated or maximized and does not further increase. Besides, using a cluster performance monitoring software it could be seen that CPUs do not work in full capacity at these circumstances.
In order to make use of maximum cluster performance a hybrid parallel running of MCNPX code was introduced using MOSIX cluster. So once the input file is created by the GUI application, the file is copied N times and the seed number in each file is set to an appropriate value which is not the same for different input files. These files are then sent to the MOSIX cluster and all of them are run simultaneously with M tasks in the background mode, in which N × M being equal to the number of CPU cores (80 cores). It must be mentioned that best choice of N and M values depends on the total number of cells in each problem and the total CPU cores of each node of cluster. In this method of parallel running, resource load balancing is very important that is done by MOSIX. After completing the run, the N output files are merged for final dose scoring by the GUI. In addition, for all simulations data communication between nodes were minimized and therefore the speedup factor of cluster were improved using PRDMP card.
Dose calculation
In MCTPV, energy deposition mesh tally (type 3) was used for dose scoring. The mesh tally is a method of measuring particle flux, dose, or other quantities on a rectangular, cylindrical, or spherical grid overlaid on top of the standard problem geometry. Particles are tracked through the independent mesh as part of the regular transport problem. The third type of mesh tally scores energy deposition data in which the energy deposited per unit volume from all particles is included. Because the mesh is independent of problem geometry, a mesh cell may cover regions of several different masses. Therefore the normalization of the output is per unit volume (MeV/cm3/source_particle), not per unit mass.[27] Thus in all simulations, mesh sizes of dose scoring were selected as same as the size of grid cells and the dose score in each mesh volume was divided by mass density using the data recorded in the material density matrix (the output is converted to MeV/g/source_particle). The MC calculated results are given in absolute dose per MU (cGy/MU) converted from dose per source particle using the same method as introduced by Siebers et al.[38] Also the correction of backscatter to the chamber from the jaws was performed as described by Liu et al.[39]
Monte Carlo calculation parameters
Energy cutoff was set to 0.05 MeV for electrons and 0.01 MeV for photons in all the simulations of MCTPV. However, these values could be changed by user. The MCNPX code provides two methods for electron energy indexing. The default method is based on the assignment of electron energy to the center of the energy bin while the second method referred to ITS-style uses the nearest group boundary. ITS v3.0 (Integrated Tiger Series) implements several corrections for correct sampling electron energy-loss straggling using the Landau distribution.[40] It was found before that using ITS-style energy indexing, calculated electron depth dose distributions by MCNP agrees well with the experimental results.[41] Therefore, ITS-style energy indexing algorithm is used in MCTPV.
Specifications of the GUI application
A GUI application has been developed using visual C# (Microsoft Visual Studio 2008). Most important capabilities of the GUI are as follows: (a) CT image display, (b) displaying and using rectangular square grid overlaying the images in order to reduce the number of pixels and generate cells (voxels), (c) merging adjacent cells with the same material to reduce the total number of cells, (d) creating of MCNPX input files (patient model and beam configuration), (e) semiautomatic-running of the Monte Carlo simulation on the cluster, and (f) displaying and analyzing of results. The patient model is built from the CT data and Monte Carlo input file related to the beam configurations is created from the plan data exported by TiGRT. Then the input files are transferred to the MOSIX cluster and are run. The Monte Carlo calculated results including isodose curves and dose at point of interest are displayed, and in the full 3D dose scoring state, the dose–volume histograms (DVHs) for the targets and the organs at risks are calculated and displayed.
Accuracy benchmarks
In order to investigate the accuracy of the MCTPV under homogenous conditions, measured and calculated depth dose curves and lateral dose distributions in water were compared for 6 and 18-MV photon beams. Measurements were made using a 0.125 cm3 Semiflex PTW ion chamber and a PTW MP3 water phantom system. The source–surface distance (SSD) used was 100 cm and field sizes considered were 4 × 4 cm2, 10 × 10 cm2, and 40 × 40 cm2 for both energies. The effective point of measurement for the ion chamber was taken into account by shifting the chamber by 0.6r0 (where r0 is the radius of the ion chamber cavity) and setting the zero point. The energy deposition mesh tally (mesh tally type 3) with cylindrical mesh type along the beam central axis was used for the Monte Carlo calculation of depth dose curves. The radius of mesh was 5 mm and z-dimension of mesh was set to 2 mm. For profile calculations a rectangular mesh tally type with a 5 × 5 mm2 square and a grid spacing of 1–10 mm (dependent on the field size) in a plane perpendicular to the beam central axis was used. The low kinetic energy cutoffs in the Monte Carlo calculation were 10 keV for photons and 50 keV for electrons. The mean energy and the full width at half maximum (FWHM) of the intensity distribution of the incident electron beam were adjusted by trial and error method so that the calculated depth dose and the dose profiles in water matched with that of the measurements. The relative statistical errors on the Monte Carlo results were generally within 1 and 2% for percentage depth doses and profiles, respectively.
For accuracy benchmarking under inhomogeneous conditions the percentage depth dose curve calculated by MCTPV were compared with that of EGS4/PRESTA in the Internal Contamination Clinical Reference (ICCR) accuracy test phantom.[42] Those results were downloaded from the National Research Council of Canada (NRCC) website (http://www.irs.inms.nrc.ca/papers/iccr00/iccr00.html). This phantom consists of 3 cm thick water, 2 cm thick aluminum, 7 cm thick lung, and 18 cm thick water. The input beam was a uniform 18-MV 1.5 × 1.5 cm2 photon beam from a realistic linear accelerator which was taken from the website. All MCTPV calculation parameters were set in accordance with the ICCR test.
Parallel processing performance analysis
A voxelized water phantom irradiated with 10 × 10 cm2 18-MV photon beam was simulated. The phantom size was fixed to 30 cm × 30 cm × 30 cm and five different numbers of voxels (33, 103, 203, 303, and 403) were chosen. The mesh tally type 3 was calculated for a 30 × 30 × 30 rectangular mesh superimposed on the phantom. No variance reduction technique was used. Two tests were done. First, traditionally the PVM version of MCNPX was used on the MOSIX cluster for simulation of all cases mentioned before, in which the number of tasks was changed from 1 to 90 (total CPU cores were 80). In this test, the effect of the number of cells on the parallel processing performance was studied. Then batch execution of PVM version of MCNPX was used on the MOSIX cluster. In this test, each input file (each case) was run simultaneously N times with M tasks in the background mode with different seed number in which N × M being equal to the number of cores (80). It must be mentioned that optimum value of M (number of tasks) for each case was obtained in the first test. Then the results of this test were compared with the traditionally running of PVM version of MCNPX with the optimum number of tasks for each case. The second method of parallel running is implemented in MCTPV.
Patient modeling of a realistic case
Patient model was made from a set of 32 CT slices with 5 mm thickness and 512 × 512 pixels/slice. Therefore, the CT data were converted to three different materials (adipose, soft tissue, and bone) based on the specific CT number thresholds for each material and then voxelized model with 128 × 128 voxels/slice was made using the grid size of 4 × 4 pixels/voxel. Then neighbor voxels with the same material were merged to reduce the total number of voxels using the cell merging algorithm.
Verification of the beam configuration of a realistic clinical plan
To assure integrity and accuracy of implementing of beam configuration and patient modeling in the MCTPV, the Monte Carlo dose calculation of a realistic clinical plan was compared with that of TiGRT planning system. Therefore a prostate conformal plan with seven beams (gantry angles: 0, 52, 103, 154, 205, 256, and 308 degree) which was created by the TiGRT planning system for the 18-MV photon beams was imported in MCTPV and dose distributions were calculated. TiGRT uses a new 3D photon dose calculation algorithm based on full scatter convolution (FSC). The dose distributions were computed by MCTPV using the treatment plan data transferred from TiGRT and the resulting isodose curves were compared.
Accuracy benchmark of an IMRT plan using 2D diode array
In order to verify the total accuracy of MCTPV, a prostate IMRT plan (including five static beams with several segments per beam) created by TiGRT planning system was used. Therefore, all beams of the plan were used to deliver the radiation at fixed SSD (equals to 100 cm) perpendicular to the MapCheck2 (SUN Nuclear, Florida, USA) in which 3 and 5 cm water equivalent slabs were placed on the top and under the MapCheck2, respectively. MapCheck2 is a 2D array of 1,527 precision diode detectors. As well, CT data of the MapCheck2 and beam configurations of the plan were imported to the MCTPV and the same setup as the measurement was used for Monte Carlo calculations. Then isodose curves of the measured data and Monte Carlo dose calculation were compared. In addition the comparison of calculated and measured dose was done using the gamma index that combines the percentage dose difference and distance to agreement (DTA).[43] For this propose gamma criteria of 3%/3 mm was used.
Accuracy benchmark using an inhomogeneous phantom
For accuracy benchmarking under inhomogeneous conditions the TiGRT Quality Dose Verification (QDV) phantom was used. This phantom illustrated in Figure 1 consists of water, lung, bone, and spinal-cord equivalent materials. Therefore, measured and Monte Carlo calculated doses at four points inside the phantom (points 1, 2, 3 and 4 in Figure 1a) were compared for a lateral beam with 15 × 10 cm2 field size, for both photon energies. To do so, CT slice data of the phantom were imported to MCTPV and the same configurations as the measurement were simulated. Measurements were done using the Farmer PTW ion chamber. For measurement, 200 MU was used and all correction factors were implemented. The relative statistical uncertainties of all voxels inside the field on the MC results were generally less than 1%.
Figure 1.
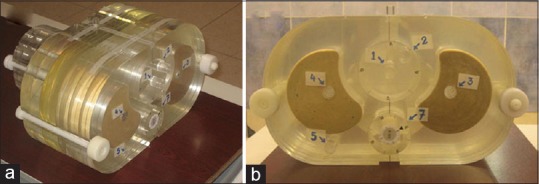
The TiGRT quality dose verification phantom which is used for accuracy benchmarks under inhomogeneous conditions; (a) three dimensional view and b) two dimensional view
Results and Discussion
Accuracy benchmark
Figure 2a and b compare the measured and calculated relative depth dose value for 6 and 18-MV photons, respectively, for three filed sizes (4 × 4 cm2, 10 × 10 cm2, and 40 × 40 cm2) in water. The relative statistical errors on the Monte Carlo results were generally less than 1%. The figures show that the Monte Carlo calculated depth dose curves agreed well with the measurements to within 1 and 1.5% for 6 and 18-MV, respectively, for all field sizes.
Figure 2.
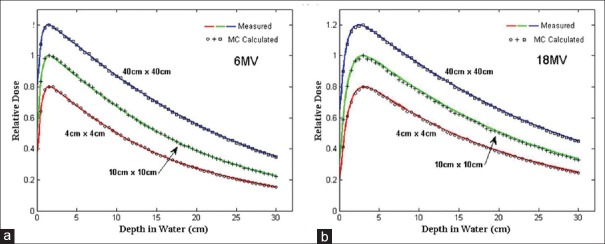
Comparison of measured and Monte Carlo calculated depth dose curves for 4 cm × 4 cm, 10 cm × 10 cm, and 40 cm × 40 cm field sizes at 100 cm SSD; (a) 6-MV photon and (b) 18-MV photon. The 4 × 4 and 40 × 40 cm2 field size data were scaled for inclusion on the same graph with all curves normalized to dmax. SSD = Source–surface distance
Figure 3 compares the measured and calculated profiles for the 6 and 18-MV photon beams. The relative statistical errors on the Monte Carlo results were generally less than 2%. In general, the agreements between the measured and Monte Carlo calculated dose profile curves were within 2% within the 50–100% isodose range and the differences in the widths of the profiles for 50% dose were within 2 mm for most of the tested field sizes and depths. As a result of the trial and error process to commission both 6 and 18-MV photon beam phase-space data, the derived mean energy and FWHM of the intensity distribution of the incident electron beam on the target were 6.15 MeV and 2 mm for 6-MV and 17.8 MeV and 1.8 mm for 18-MV photon, respectively.
Figure 3.
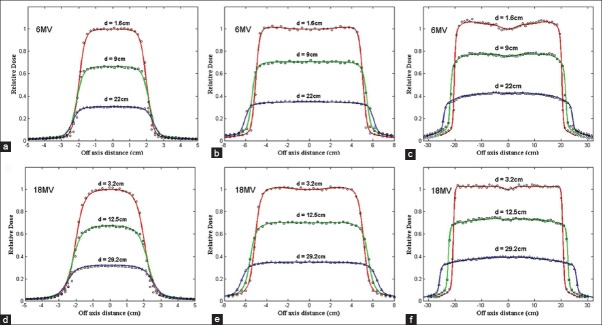
Comparison of lateral dose distribution in a water phantom measured using a semiflex PTW ion chamber (shown in curves) and Monte Carlo calculated (shown in symbols) at 1.6, 9, and 22 cm depths in water for 6-MV photon beams and at 3.2, 12.5, and 29.2 cm depths in water for 18-MV photon beams. For both energy SSD was 100cm. (a) 6-MV and 4 × 4 cm2 field size, (b) 6-MV and 10×10 cm2 field size, (c) 6-MV and 40 × 40 cm2 field size, (d) 18-MV and 4 × 4 cm2 field size, (e) 18-MV and 10 × 10 cm2 field size, and (f) 18-MV and 40 × 40 cm2 field size
Figure 4 shows the results of the 18-MV photon beam percentage depth dose curves for a 1.5 × 1.5 cm2 open field calculated by EGS4/PRESTA and MCTPV in the ICCR test phantom. The results showed good agreement within 1.5% between them. The relative statistical errors on the Monte Carlo results were within 0.5%.
Figure 4.
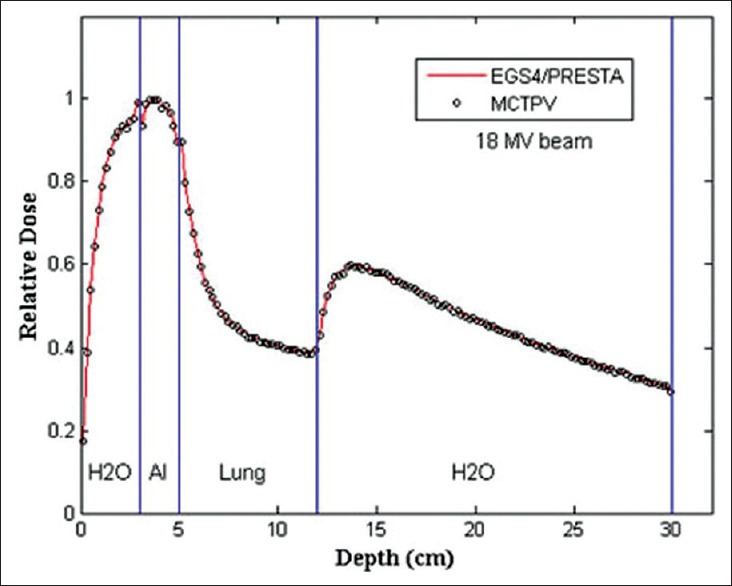
Results of the percentage depth dose curves calculated by EGS4/PRESTA and MCTPV in the ICCR accuracy test phantom. ICCR = Internal Contamination Clinical Reference
Parallel processing performance analysis
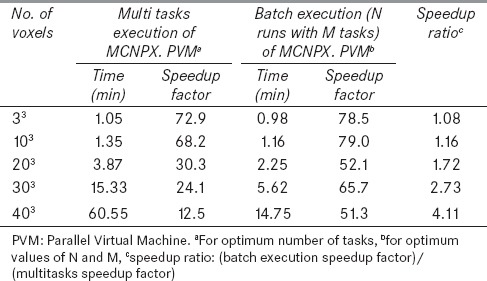
Figure 5 shows the speedup factor versus the number of tasks for different number of voxels. As it can be seen, the speedup factor decreases while the number of voxels increases. In addition, there is an optimum task value for each number of voxel which shifts to lower values as the number of voxels increases. This is due to more data communication between nodes for the increased tasks. Table 2 demonstrates timing results of MOSIX cluster for the same problems with different number of parallel runs (N) and tasks (M). As it can be seen, optimum values of N and M were 8 and 10, respectively, for all simulated cases. To compare the performances of the two used methods (multitasking with the specific tasks value and batch execution including N simultaneous runs with M tasks), their optimum results are summarized in Table 3. It is evident that the speedup factor of the second method is greater than that of the first method for all cases. Moreover, as given in the last column of Table 3, the speedup ratio between these two methods increases considerably for problems with a large number of voxels. As shown in Table 3, batch execution of eight simultaneously run with 10 tasks resulted in more than 75% reduction in the simulation time for the case with 403 voxels. Also it can be concluded that this method is more efficient for the problems with the larger number of cells. Thus this method of parallel computing, that has an essential roll to reduce the simulation time, is implemented in MCTPV.
Figure 5.
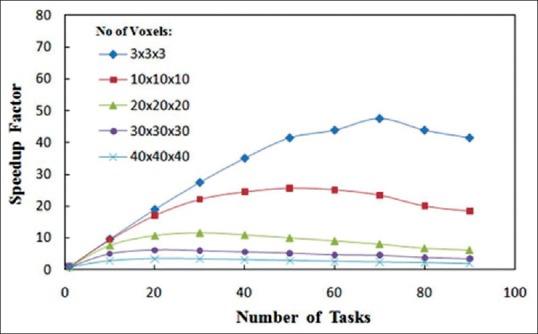
Speedup factor versus the number of tasks on an 80-core cluster for a 30 × 30 × 30 cm3 water phantom irradiated with a 18-MV photon beam of 10 × 10 cm2 field size. The number of voxels in the phantom were varied and mesh tally type 3 was used with 30 × 30 × 30 rectangular mesh superimposed on the phantom
Table 2.
Timing results (in minute) of batch execution with different N (number of simultaneously run) and M (number of tasks for each run) values on the 80-core MOSIX cluster for 10 million photons. The number of voxels in the phantom was varied and mesh tally type 3 was used with a 30×30×30 rectangular mesh superimposed on the phantom

Table 3.
Comparison of timing results of two used methods on the 80-core MOSIX cluster for 10 million photons for different number of voxels in the phantom
Cell merging results
Figure 6a illustrates a CT slice of a prostate case with 512 × 512 pixels. The voxelized model of this slice with 128 × 128 voxel/slice and the merged-voxels model are shown in Figure 6b and c, respectively. Total voxels and material assigned to the 32 slices before cell merging algorithm were 524,289 cell and 17 material compositions, respectively. After cell merging, total number of voxels was reduced to 44,038. As it can be seen, Figure 6b is the same as Figure 6c and there is no reduction of accuracy of the geometry.
Figure 6.
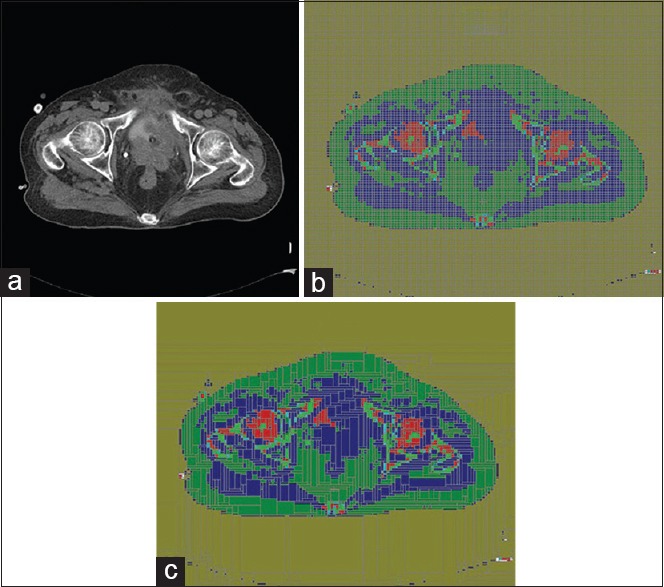
(a) A prostate CT slice image with 512 × 512 pixels, (b) segmented image to 128 × 128 voxels (including 16,384 voxels/slice), (c) converted image using cell merging algorithm (including 1,643 voxels/slice). CT = Computed tomography
Verification of the beam configuration in a realistic clinical plan
Figure 7a and b show the results of 18-MV photon beam dose distributions for a prostate conformal treatment plan including seven beams calculated by TiGRT treatment planning system and MCTPV, respectively. For Monte Carlo calculations 200 million particles were simulated, for which the relative statistical uncertainty of all voxels with a dose greater than Dmax/2 was less than 2%. In this case, total time of simulation was about 3.5 h CPU time on the entire 80-core MOSIX cluster. As it can be seen, the dose distributions are similar to that of TiGRT. Therefore, the beam configuration and the patient information are well implemented in MCTPV.
Figure 7.
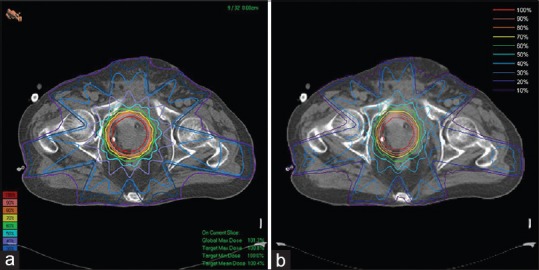
The 18-MV photon beam dose distributions for a prostate conformal plan: (a) Calculated by TiGRT treatment planning system, (b) calculated by Monte Carlo (MCTPV). The isodose line is normalized to the isocenter dose. Total time of simulations was about 3.5 h on the 80-core cluster. TPV = Treatment plan verification
Results of an IMRT plan verification using 2D array diode detector
Figure 8 shows the calculated and measured relative dose distributions of an 18-MV prostate IMRT plan that was delivered to the phantom. The relative statistical errors on the Monte Carlo results were generally less than 0.5%. As it can be seen, good agreement between measurements and Monte Carlo was found.
Figure 8.
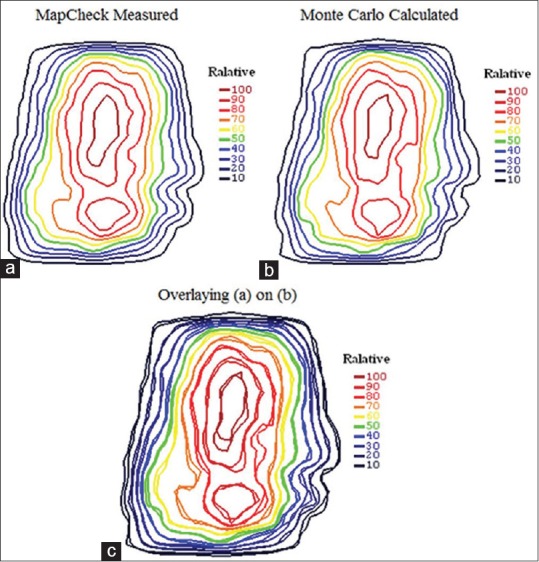
Relative dose distributions of the total beams of 18-MV IMRT plan in the middle plane of the MapCheck2 in which all beams delivered perpendicular to the MapCheck2 at the fixed SSD: (a) MapCheck2 measurement, (b) Monte Carlo calculated, and (c) overlaying of them
In addition, the gamma passing rate with gamma criteria of 3%/3 mm, was found to be 98.5% for the total delivered beams.
Accuracy benchmark under inhomogeneous conditions
Figure 9 shows the Monte Carlo calculated dose distribution of an 18-MV photon beam inside the TiGRT phantom which was used for comparing the calculated and measured absolute dose of several points of interest. The relative statistical errors on the Monte Carlo results were generally less than 0.5%. Table 4 shows the Monte Carlo calculated and measured doses for 6 and 18-MV photon beams of four points inside the phantom. As shown, good agreement between Monte Carlo calculated and measured doses (within 1.5%) was obtained for both energies.
Figure 9.
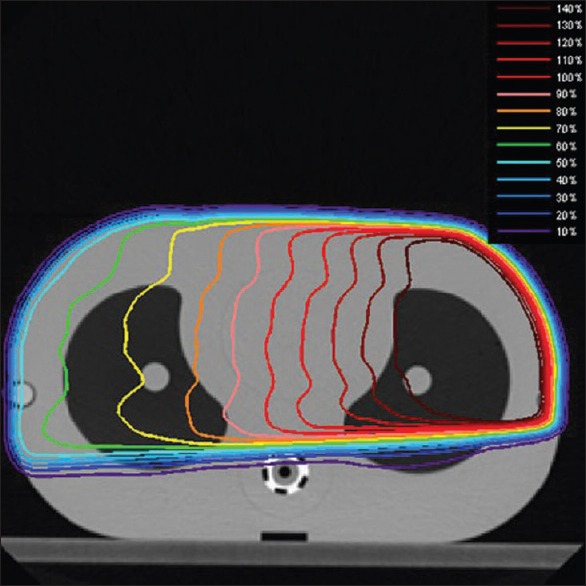
Monte Carlo calculated dose distributions in the TiGRT QDV phantom for an 18-MV photon beam with 15 × 10 cm2 field sizes
Table 4.
Comparisons of dose values of different points inside the TiGRT QDV phantom provided by the Monte Carlo (MC) calculation and measurement for a lateral beam with 10×15 cm2 filed size, for 6 and 18-MV photon

Conclusion
A MCTPV system was developed for clinical TPV, especially for conformal and IMRT plan verification in which MCNPX Monte Carlo code has been used for particle transport in all parts. Several methods including mesh tally capabilities of MCNPX, cells merging algorithm, phase-space data, and batch execution with multitasking on the MOSIX cluster were implemented together to reduce the overall simulation time. MCTPV has an interface with TiGRT planning system and reads plan data created by TiGRT planning system. The phase-space data of our 6 and 18-MV photon beams were developed and several benchmarks were performed under homogenous and inhomogeneous conditions. For both energies, the Monte Carlo results showed good agreement with the measurements within 2% in general. Results of parallel processing of the MCNPX code showed that the batch execution of PVM version of MCNPX on the MOSIX cluster instead of conventional parallel running of the code increases the performance. Particularly, the performance improvement was significant for the problems with large number of cells such as CT-based Monte Carlo treatment planning. For instance, there was a more than fourfold increase in the speedup ratio as compared to conventional multitasking for simulation of a sample case with 64,000 cells. Comparing the dose calculations of MCTPV and TiGRT planning system for a prostate conformal plan validated the integrity of MCTPV and the implementation of beams and patient configuration. The MapCheck2 measured dose distribution of all beams of an IMRT plan agreed well with that of MCTPV in which the gamma passing rate was 98.5%. Also, a comparison between MCTPV calculated and measured dose of several points inside the inhomogeneous phantom (TiGRTQDV phantom) showed good agreement within 1.5% for both energies. MCTPV could be used for quality assurance of IMRT treatment planning and clinical patient study with regards to the accuracy and timing results of it.
Footnotes
Source of Support: Nil
Conflict of Interest: None declared.
References
- 1.Kim JO, Siebers JV, Keall PJ, Arnfield MR, Mohan R. A Monte Carlo study of radiation transport through multi leaf collimators. Med Phys. 2001;28:2497–506. doi: 10.1118/1.1420734. [DOI] [PubMed] [Google Scholar]
- 2.Spirou SV, Chui CS. Generation of arbitrary intensity profiles by dynamic jaws or multileaf collimators. Med Phys. 1994;21:1031–41. doi: 10.1118/1.597345. [DOI] [PubMed] [Google Scholar]
- 3.Van Santvoort JP, Heijmen BJ. Dynamic multileaf collimation without ‘tongue-and-groove’ underdosage effects. Phys Med Biol. 1996;41:2091–105. doi: 10.1088/0031-9155/41/10/017. [DOI] [PubMed] [Google Scholar]
- 4.Webb S, Bortfeld T, Stein J, Convery D. The effect of stair-step leaf transmission on the ‘tongue-and-groove problem’ in dynamic radiotherapy with a multileaf collimator. Phys Med Biol. 1997;42:595–602. doi: 10.1088/0031-9155/42/3/011. [DOI] [PubMed] [Google Scholar]
- 5.Ma CM, Pawlicki T, Jiang SB, Li JS, Deng J, Mok E, et al. Monte Carlo verification of IMRT dose distributions from a commercial treatment planning optimization system. Phys Med Biol. 2000;45:2483–95. doi: 10.1088/0031-9155/45/9/303. [DOI] [PubMed] [Google Scholar]
- 6.Wang L, York E, Chui CS. Monte Carlo evaluation of 6 MV intensity modulated radiotherapy plans for head and neck and lung treatments. Med Phys. 2002;29:2705–17. doi: 10.1118/1.1517291. [DOI] [PubMed] [Google Scholar]
- 7.Francescon P, Cora S, Chiovati P. Dose verification of an IMRT treatment planning system with the BEAM EGS4-based Monte Carlo code. Med Phys. 2003;30:144–57. doi: 10.1118/1.1538236. [DOI] [PubMed] [Google Scholar]
- 8.Yang J, Li J, Chen L, Price R, McNeeley S, Qin L, et al. Dosimetric verification of IMRT treatment planning using Monte Carlo simulations for prostate cancer. Phys Med Biol. 2005;50:869–78. doi: 10.1088/0031-9155/50/5/011. [DOI] [PubMed] [Google Scholar]
- 9.Sakthi N, Keall PJ, Mihaylov I, Wu Q, Wu Y, Williamson JF, et al. Monte Carlo based dosimetry of head-and-neck patients treated with SIB-IMRT. Int J Radiat Oncol Biol Phys. 2006;64:968–77. doi: 10.1016/j.ijrobp.2005.09.049. [DOI] [PubMed] [Google Scholar]
- 10.Ezzell GA, Galvin JM, Low D, Palta JR, Rosen I, Sharp MB, et al. Guidance document on delivery, treatment planning, and clinical implementation of IMRT: Report of the IMRT Subcommittee of the AAPM Radiation Therapy Committee. Med Phys. 2003;30:2089–115. doi: 10.1118/1.1591194. [DOI] [PubMed] [Google Scholar]
- 11.Low DA, Dempsey JF, Venkatesan R, Mutic S, Markman J, Mark Haacke E, et al. Evaluation of polymer gels and MRI as a 3-D dosimeter for intensity modulated radiation therapy. Med Phys. 1999;26:1542–51. doi: 10.1118/1.598650. [DOI] [PubMed] [Google Scholar]
- 12.Gustavsson H, Karlsson A, Back SA, Olsson LE, Haraldsson P, Engstrom P, et al. MAGIC-type polymer gel for three dimensional dosimetry: Intensity modulated radiation therapy verification. Med Phys. 2003;30:1264–71. doi: 10.1118/1.1576392. [DOI] [PubMed] [Google Scholar]
- 13.Kawrakow I, Rogers DW. National Research Council of Canada Ottawa NRCC Report PIRS-701; 2000. The EGSnrc code system: Monte Carlo simulation of electron and photon transport. [Google Scholar]
- 14.Rogers DW, Faddegon BA, Ding GX, Ma CM, We J, Mackie TR. BEAM: A Monte Carlo code to simulate radiotherapy treatment units. Med Phys. 1995;22:503–24. doi: 10.1118/1.597552. [DOI] [PubMed] [Google Scholar]
- 15.Sempau J, Acosta E, Baro J, Fernandez-Varea JM, Salvat F. An algorithm for Monte Carlo simulation of coupled electron–photon transport. Nucl Instrum Meth B. 1997;132:377–90. [Google Scholar]
- 16.Briesmeister JF. MCNP-A General Monte Carlo N-Particle Transport Code, Version 4C, Los Alamos National Laboratory Report No. LA-13709-M. 2000 [Google Scholar]
- 17.Agostinelli S, Allison J, Amako K. GEANT4–A simulation toolkit. Nucl Instr Meth Phys Res A. 2003;506:250–303. [Google Scholar]
- 18.Fippel M. Fast Monte Carlo dose calculation for photon beams based on the VMC electron algorithm. Med Phys. 1999;26:1466–75. doi: 10.1118/1.598676. [DOI] [PubMed] [Google Scholar]
- 19.Kawrakow I. VMC++, electron and photon Monte Carlo calculations optimized for radiation treatment planning Advanced Monte Carlo for Radiation Physics, Particle Transport Simulation and Applications: Proc. Monte Carlo 2000 Meeting. Lisbon. In: Kling A, Barao F, Nakagawa M, T’ avora L, Vaz P, editors. Berlin: Springer; 2001. pp. 229–36. [Google Scholar]
- 20.Sempau J, Wilderman SJ, Bielajew AF. DPM, a fast, accurate Monte Carlo code optimized for photon and electron radiotherapy treatment planning dose calculations. Phys Med Biol. 2000;45:2263–91. doi: 10.1088/0031-9155/45/8/315. [DOI] [PubMed] [Google Scholar]
- 21.Ma CM, Li JS, Pawlicki T, Hiang SB, Deng J, Lee MC, et al. A Monte Carlo dose calculation tool for radiotherapy treatment planning. Phys Med Biol. 2002;47:1671–89. doi: 10.1088/0031-9155/47/10/305. [DOI] [PubMed] [Google Scholar]
- 22.Yamamoto T, Mizowaki T, Miyabe Y, Takegawa H, Narita Y, Yano S, et al. An integrated Monte Carlo dosimetric verification system for radiotherapy treatment planning. Phys Med Biol. 2007;52:1991–2008. doi: 10.1088/0031-9155/52/7/014. [DOI] [PubMed] [Google Scholar]
- 23.Alexander A, Deblois F, Stroian G, Al-Yahya K, Heath E, Seuntjens J. MMCTP: A radiotherapy research environment for Monte Carlo and patient specific treatment planning. Phys Med Biol. 2007;52:N297–308. doi: 10.1088/0031-9155/52/13/N03. [DOI] [PubMed] [Google Scholar]
- 24.Fix MK, Manser P, Frei D, Volken W, Mini R, Born EJ. An efficient framework for photon Monte Carlo treatment planning. Phys Med Biol. 2007;52:N425–37. doi: 10.1088/0031-9155/52/19/N01. [DOI] [PubMed] [Google Scholar]
- 25.Yaikhom G, Giddy JP, Walker DW, Downes PE, Spezi E, Lewis DG. Washington: IEEE Computer Society; 2008. A distributed simulation framework for conformal radiotherapy. In: Proceedings of the 22nd IEEE International Parallel and Distributed Processing Symposium (IPDPS) pp. 1–8. [Google Scholar]
- 26.González-Castaño DM, Pena J, Gómez F, Gago-Arias A, González-Castaño FJ, Rodríguez-Silva DA, et al. eIMRT: A web platform for the verification and optimization of radiation treatment plans. J Appl Clin Med Phys. 2009;10:205–20. doi: 10.1120/jacmp.v10i3.2998. [DOI] [PMC free article] [PubMed] [Google Scholar]
- 27.Los Alamos National Laboratory Report No. LA-CP-02-0408; 2002. X Monte Carlo Team. MCNPX user's manual Version 2.4.0. [Google Scholar]
- 28.Ajaj FA, Ghassa NM. An MCNP-based model of a medical linear accelerator x-ray photon beam. Australas Phys Eng Sci Med. 2003;26:140–4. doi: 10.1007/BF03178784. [DOI] [PubMed] [Google Scholar]
- 29.Goorley T, Olsher D. Los Alamos National Laboratory Report No. LA-UR-05-2755; 2005. Using MCNP5 for medical physics applications. [Google Scholar]
- 30.Joneja OP, Negreanu C, Stepanek J, Chawla R. Comparison of Monte Carlo simulations of photon/electron dosimetry in microscale applications. Phys Eng Sci Med. 2003;26:62–8. [PubMed] [Google Scholar]
- 31.Lin H, Wu DS, Wu AD. Effects of treatment distance and field size on build-up characteristics of Monte Carlo calculated absorbed dose for electron irradiation. Australas Phys Eng Sci Med. 2004;27:219–23. doi: 10.1007/BF03178652. [DOI] [PubMed] [Google Scholar]
- 32.X-5 Monte Carlo Team. Los Alamos National Laboratory Report No. LA-UR-03-1987; 2008. MCNP-A general Monte Carlo N-particle transport code Version 5. [Google Scholar]
- 33.Schneider W, Bortfeld T, Schlegel W. Correlation between CT numbers and tissue parameters needed for Monte Carlo simulations of clinical dose distributions. Phys Med Biol. 2000;45:459–78. doi: 10.1088/0031-9155/45/2/314. [DOI] [PubMed] [Google Scholar]
- 34.International commission on radiation units and measurements. Tissue substitutes in radiation dosimetry and measurement. ICRU Report No. 44. 1989 [Google Scholar]
- 35.International commission on radiation units and measurements. Photon, electron, proton and neutron interaction data for body tissues. ICRU Report No. 46. 1992 [Google Scholar]
- 36.Haddad IF, Paquin E. MOSIX: A cluster load-balancing solution for linux. Linux J. 2001;2011:85es. [Google Scholar]
- 37.Barak A, Laadan O. The MOSIX multicomputer operating system for high performance cluster computing. Future Gener Comput Sys. 2001;13:361–72. [Google Scholar]
- 38.Siebers JV, Keall PJ, Libby B, Mohan R. Comparison of EGS4 and MCNP4b Monte Carlo codes for generation of photon phase space distributions for a Varian 2100C. Phys Med Biol. 1999;44:3009–26. doi: 10.1088/0031-9155/44/12/311. [DOI] [PubMed] [Google Scholar]
- 39.Liu HH, Mackie TR, McCullough EC. Modeling photon output caused by backscattered radiation into the monitor chamber from collimator jaws using a Monte Carlo technique. Med Phys. 2000;27:737–44. doi: 10.1118/1.598936. [DOI] [PubMed] [Google Scholar]
- 40.Halbleib JA, Kensek RP, Valdez GD, Seltzer SM, Berger MJ. ITS: The integrated TIGER series of electron/photon transport codes version 3.0. IEEE. Trans Nucl Sci. 1992;39:1025–29. [Google Scholar]
- 41.Jeraj R, Keall PJ, Ostwald PM. Comparisons between MCNP, EGS4 and experiment for clinical electron beams. Phys Med Biol. 1999;44:705–17. doi: 10.1088/0031-9155/44/3/013. [DOI] [PubMed] [Google Scholar]
- 42.Rogers DW, Mohan R. Questions for comparison of clinical Monte Carlo code. In: Schlegel W, Bortfeld T, editors. Heidelberg, Germany, Berlin: Proc. 13th Int. Conf. on the Use of Computers in Radiation Therapy (ICCR), Springer; 2000. pp. 120–2. [Google Scholar]
- 43.Nelms B, Simon W, Jursinic P. Verification of IMRT delivery using a 2-D diode array and analysis software (Abstract) Med Phys. 2002;29:1364. doi: 10.1118/1.1567831. [DOI] [PubMed] [Google Scholar]


