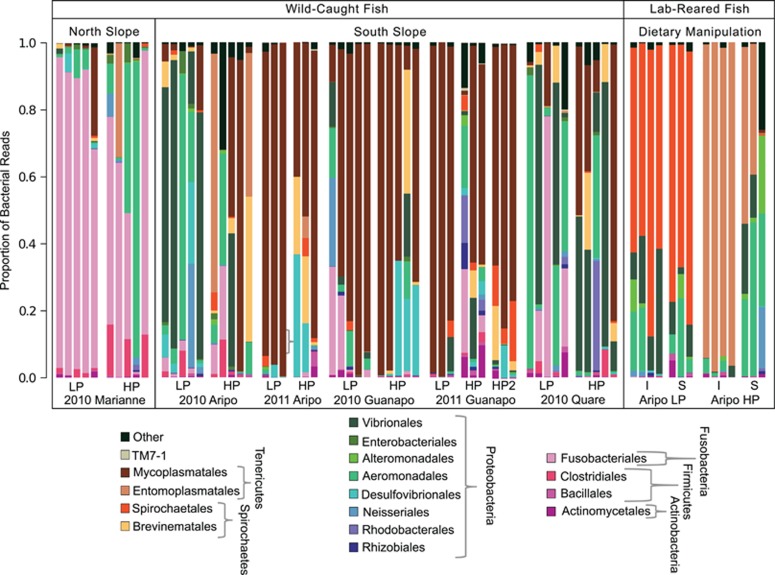
Figure 1.
Taxonomic composition of gut bacterial communities. Results are based on 454 pyrosequencing across 55 Trinidadian guppies from the wild and 14 included in a dietary manipulation experiment. Stream, ecotype and year of collection are listed on the x-axis for wild-caught fish. Communities in the central box represent gut bacteria of guppies from three streams on the southern slope of the Northern range, and those in the leftmost box show gut bacteria of guppies from a stream on the northern slope. Columns in the rightmost box represent samples taken after the dietary manipulation experiment in the lab, for which fish collected in 2011 from the Aripo were used, and HP fish and LP fish were fed either an invertebrate (I) or spinach (S)-based diet. Bacteria are classified to order by color, with phyla indicated to the right of ordinal labels.

