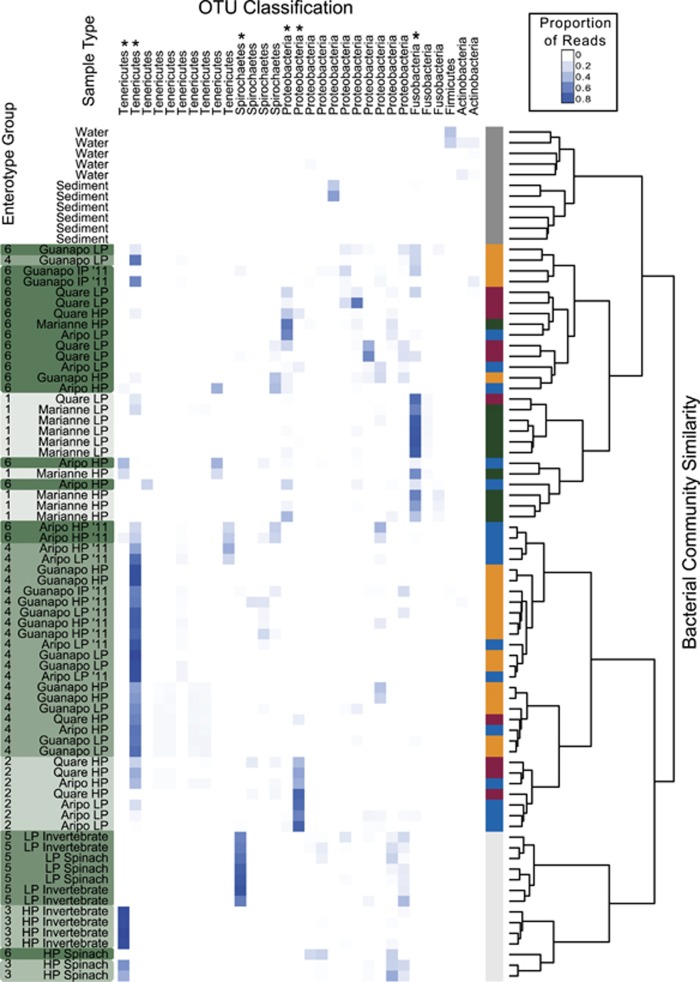
Figure 2.
Bacterial community composition and enterotype groupings in relation to 97% OTU distributions. A heatmap is shown for all OTUs with over 500 reads in the whole data set. The phylum associated with each OTU is listed above, and the asterisks indicate dominant OTUs that appear to be driving enterotype groupings (Supplementary Table 5). The shade of blue in the heatmap indicates the proportion of reads that come from the given OTU out of all reads for that sample. The color bar on the right of the heatmap indicates experiment/sample type—light gray: samples from the dietary manipulation experiment; dark gray: non-fish environmental samples; remaining colors: 2010 and 2011 field collections (yellow: Guanapo; red: Quare; green: Marianne; and blue: Aripo). Names on the left aid in further classifying samples, with ‘11' denoting field samples obtained in 2011 (2010 samples have no year abbreviation), and LP/HP/HP2 abbreviations are used as described for Figure 1. The sample names on the left are also shaded in green according to their enterotype grouping (displayed to the left of the sample label). The dendrogram on the right shows community similarity based on hierarchical clustering using Ward's method.

