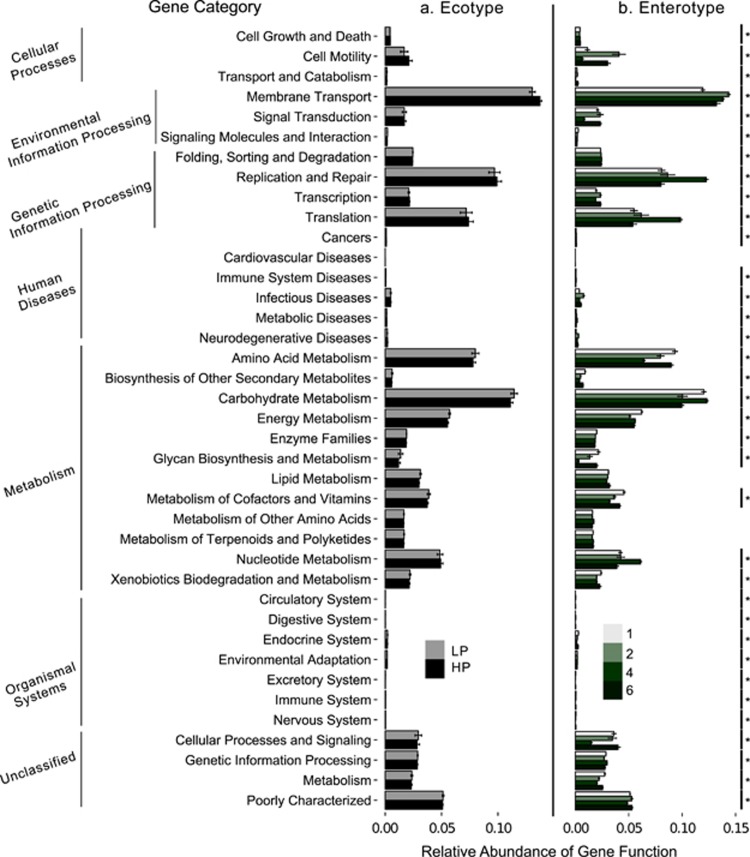
Figure 5.
Results of PICRUSt analysis showing predicted relative abundance of KEGG ortholog groups for guppy (a) ecotypes and (b) enterotypes. Asterisks on the right of each panel indicate significant differences among groups. No significant differences were found between ecotypes, whereas the majority of KEGG orthogroups differed among Enterotypes. The samples from the dietary manipulation (and their two associated enterotypes: 3 and 5) are not shown because an insufficient number of reads per sample (<800) clustered with the closed reference OTUs in approximately one third of the dietary manipulation samples.

