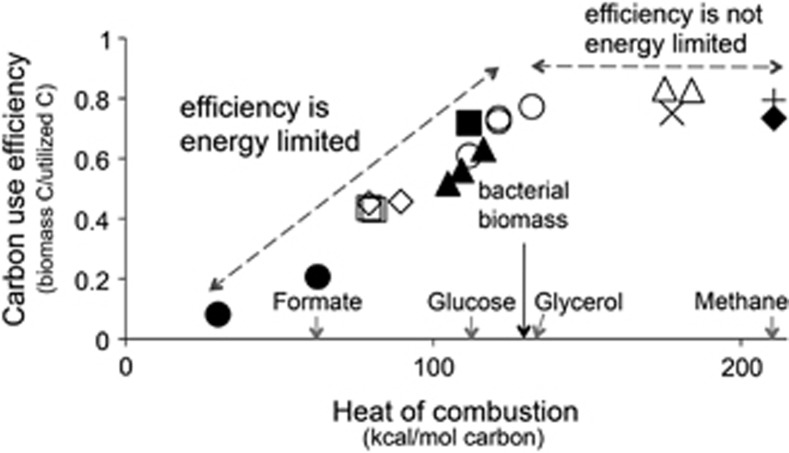
Figure 2.
CUE of 10 bacterial species related to the energy content of the organic compound supporting growth (calculated from Linton and Stephenson, 1978). Distinct symbols represent different bacterial species. The heat of combustion of representative organic compounds and an average for bacterial biomass (E. coli (130.2) and M. methylotrophus (132.5), calculated from Cordier et al., 1987) are presented on the x axis.

