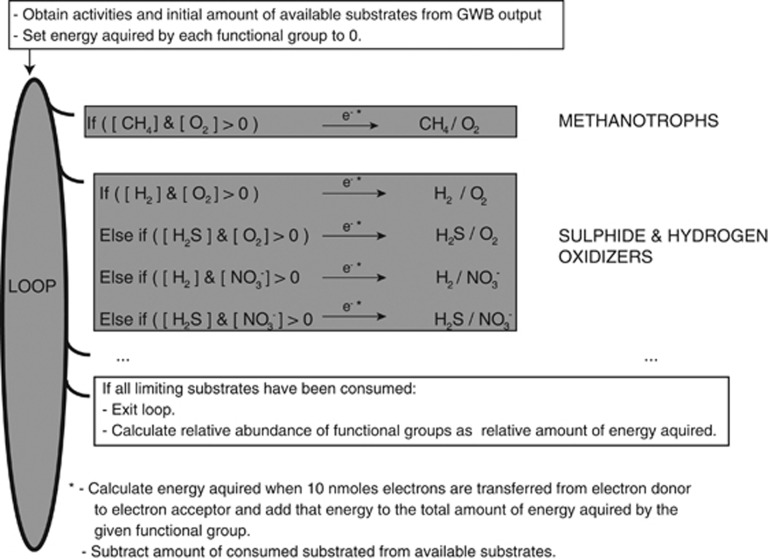
Figure 3.
Illustration of the implementation of community composition models in a computer script. For clarity, only two functional groups are shown. First, activities and total amounts of each substrate were extracted from the GWB output. In some cases (specified in the results section), the amounts of oxygen and hydrogen sulphide were decreased stoichiometrically (2:1, see Table 3) at this step to simulate the effect of abiotic sulphide oxidation. Second, a loop was initiated where for each iteration each functional microbial group was allowed to acquire energy by the transfer of 10 nmol of electrons in a redox reaction within the definition of that group. The consumption of each reactant was then calculated and subtracted from the amount of substrate available. A given redox reaction was allowed to be used as an energy source only as long as none of the substrates had been fully consumed. For functional microbial groups able to use multiple redox reactions (such as sulphide and hydrogen oxidizers), the most exergonic reaction was selected at each step. The loop was continued until none of the redox reactions were allowed to proceed owing to substrate limitations. Finally, the relative abundance of each functional microbial group was calculated as the relative amount of energy acquired by that group. Note that the community composition models take into account that the redox reactions considered are not independent as some reactants occur in several reactions. Hence, different functional groups may compete for some of the same substrates (e.g. all aerobic organisms compete for oxygen).

