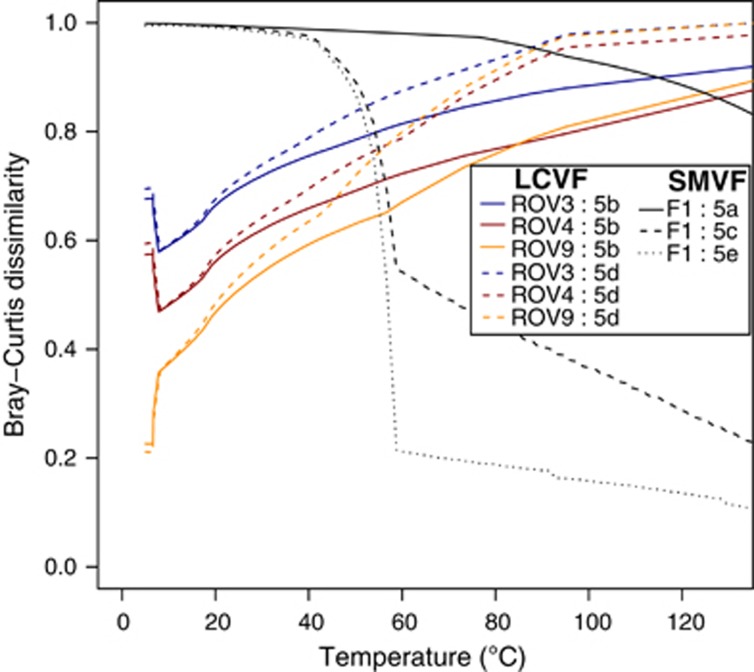
Figure 8.
BCDs between microbial community compositions assessed from observed 16S rRNA gene sequences (Figure 7) and modelled communities. As indicated, each line shows BCD values from comparisons between one sample and communities shown in one of the subfigures of Figure 5. For example, blue solid lines show BCD values from comparisons between ROV3 and predicted communities for different temperatures at LCVF as shown in Figure 5b. All solid lines involve comparisons with predictions based on the assumption that no abiotic sulphide oxidation takes place. Dashed lines involve comparisons with predictions based on models assuming that up to 10% of the sulphide reacts with oxygen abiotically. The dotted line shows comparisons between F1 and predicted communities that were based on a model where anaerobic methane oxidizers can use nitrate as the electron acceptor in addition to sulphate. Also in this case the model assumes that up to 10% of the sulphide reacts with oxygen abiotically. BCD can take values between 0 and 1, where high values indicate low similarities between observed and modelled communities. Note that BCD involving F1 and F4 samples gave highly similar results and that only F1 is plotted for clarity.

