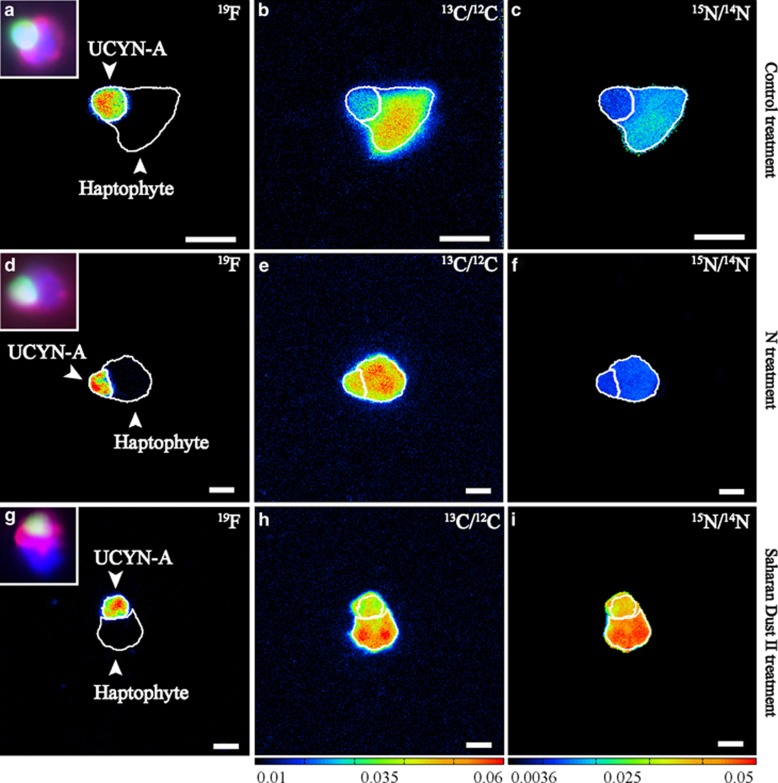
Figure 2.
Visualization of the UCYN-A–haptophyte association according to the probe-conferred 19F signal (left panels a, d, g) and single-cell activities based on isotope ratios of C (13C/12C=middle panels b, e, h) and N (15N/14N=right panels c, f, i) within different nutrient amendment incubation experiments. Inset panels on the left side show the corresponding epifluorescence images of the UCYN-A cells (green signal) and its associated haptophyte cell (red signal), as well as DAPI staining (blue signal) based on double CARD–FISH approach taken before nanoSIMS analysis. NanoSIMS images refer to different nutrient amendment incubation experiments: (a–c) Control=no nutrient added, (d–f) N=NH4NO3 addition, (g–i) DII=4 mg l−1 Saharan dust. Warmer colors represent higher abundance of the heavier isotopes.

