Figure 3.
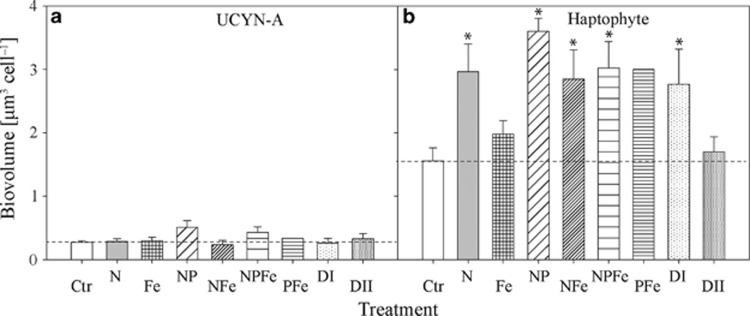
Mean biovolumes with s.e. for (a) UCYN-A and (b) the associated haptophyte cells in the different treatments as described in the Materials and Methods. The asterisks indicate a statistically significant difference compared with the control. No statistics were performed on results from the PFe treatment because only one UCYN-A–haptophyte association was found. Dashed lines indicate mean values of control measurements.

