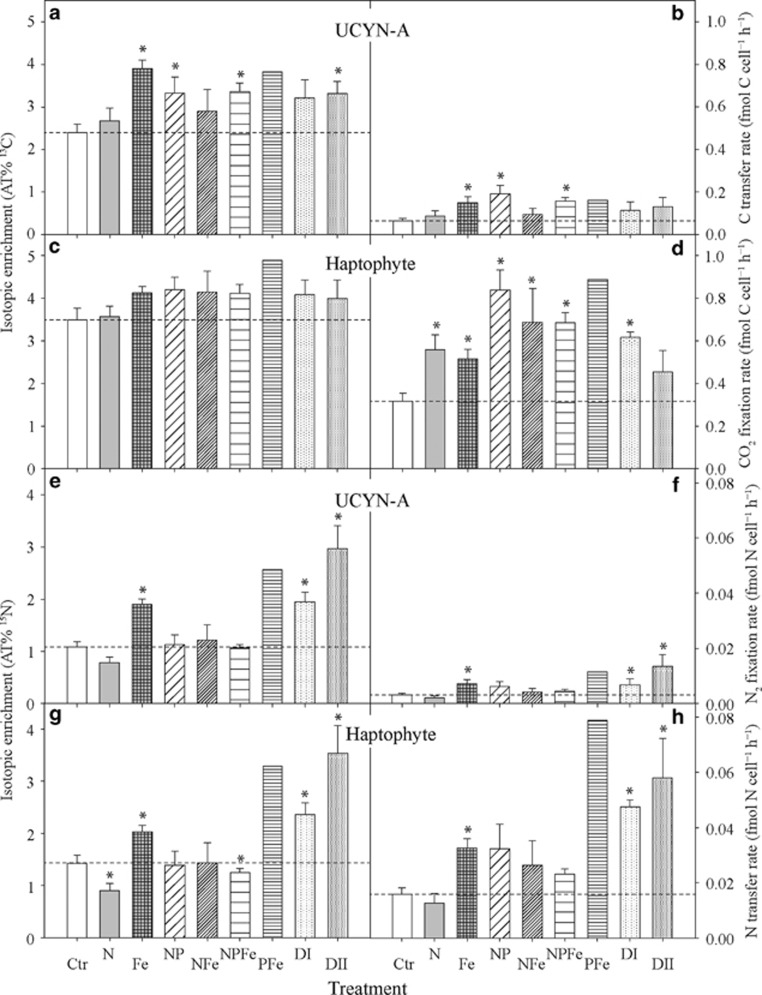
Figure 4.
NanoSIMS measurements for the association between UCYN-A and their associated haptophytes from the nutrient amendment experiments. The panels on the left side represent the isotope enrichment in AT% for individual cells for 13C (a, UCYN-A; c, haptophyte) and 15N (e, UCYN-A; g, haptophyte). The panels on the right side (b, d, f, h) show the corresponding single-cell activity in fmol cell–1 h–1 for CO2 and N2 fixation, as well as C and N transfer rates for individual UCYN-A and partner haptophyte cells, calculated based on obtained nanoSIMS values (AT%) and cell dimension analysis. Treatments are as described in Materials and Methods. The asterisk symbol indicates means that are significantly different from the control at a P<0.05 significance level. No statistics were performed on the PFe treatment. Dashed lines indicate mean values of control measurements.

