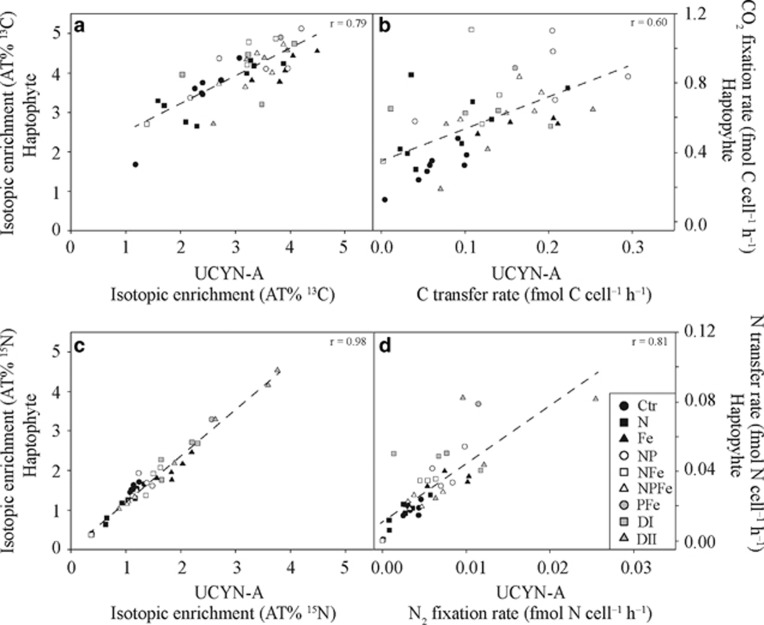
Figure 5.
Single-cell enrichments and rates for (a, b) carbon in AT% 13C and fmol C cell–1 h–1, respectively, and for (c, d) nitrogen in AT% 15N and fmol N cell–1 h–1, respectively, within individual associations between UCYN-A and its corresponding haptophyte partner cell across all treatments. Dashed lines represent regression lines and their corresponding r-values are depicted within each panel. Treatments are as described in Materials and Methods.

