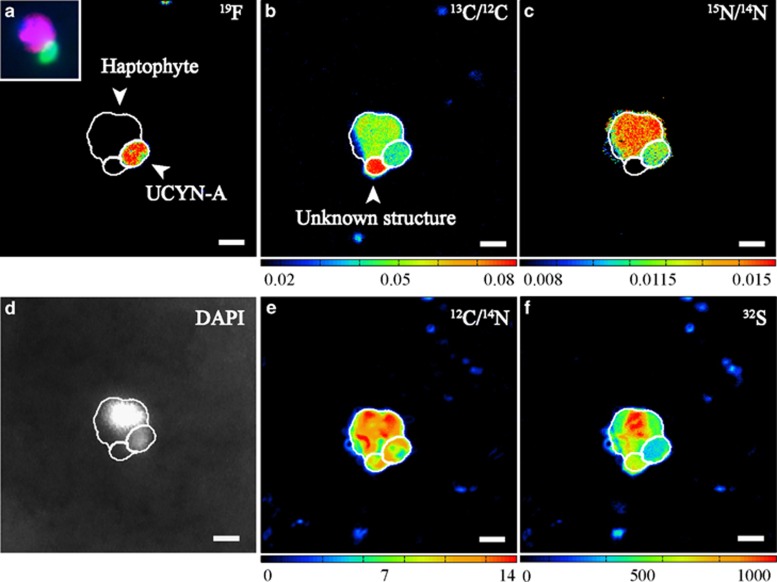
Figure 6.
NanoSIMS measurements visualizing the ‘unknown structure' found attached to a UCYN-A–haptophyte association within the NP treatment. (a) The probe-conferred 19F signal and the corresponding epifluorescence images of the UCYN-A cells (green signal) and its associated haptophyte cell (red signal), as well as DAPI staining (blue signal) based on double CARD–FISH approach taken before nanoSIMS analysis (small inset panel). (b) Carbon enrichment as 13C/12C, (c) nitrogen enrichment as 15N/14N, (d) black and white image of the DAPI signals, (e) carbon and nitrogen distribution as 12C/14N * 1000 and (f) sulfur as 32S. An unknown structure attached to the UCYN-A association was observed that is highly enriched in C, but lower in N and had a weak DAPI signal (b, c, d). In addition to carbon and nitrogen (b, c, e) the structure contained sulfur (f). Such a structure was only found when inorganic nitrogen was added. Warmer colors represent higher abundance of the heavier isotopes. Brighter white DAPI signals indicate stronger staining because of more DNA.

