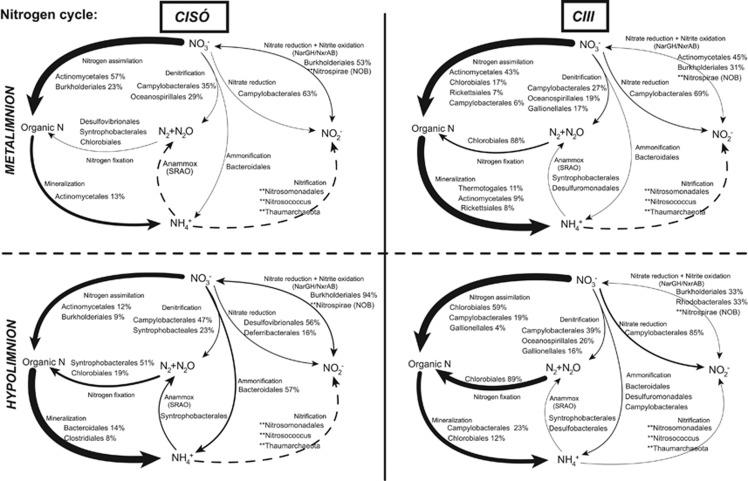
Figure 5.
Genetic potential for several steps of the nitrogen cycle in Lake Cisó and Banyoles basin C-III using a combination of normalized marker genes. Arrow size proportional to the potential flux of the nitrogen pathways (100% value, see Supplementary Table S3). Dotted lines: not detected marked genes but putative presence of the pathway (see main text). Relative abundances for the main microbes potentially driving each conversion step are shown (only for those that contributed >1% of the marker genes mixture). **Presence of AOA, AOB and nitrite-oxidizing bacteria (NOB) reads in the metagenomic pool.

