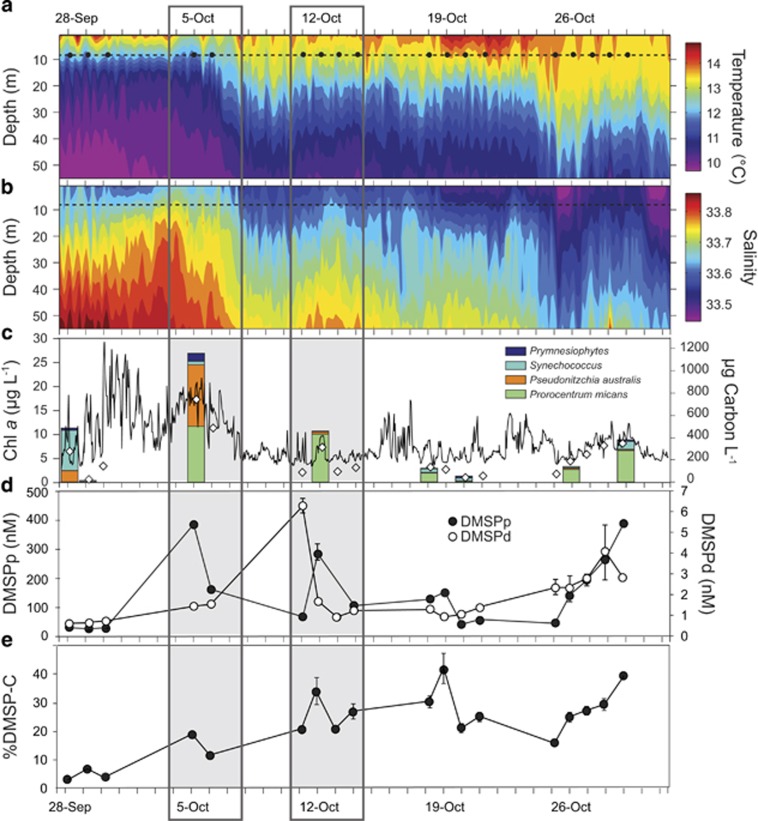
Figure 3.
(a, b) Time series of water column temperature and salinity collected by CTD sensors on the M0 mooring. The dotted lines indicate the deployment depth of the ESP and black dots in panel a indicate molecular sampling events. (c) Concentration of Chlorophyll a (Chl a) collected by a CTD instrument deployed on the ESP (solid line), and discrete measurements of Chl a (gray diamonds) and phytoplankton biomass (stacked bars, color coded by major species) obtained from Niskin bottle collections near the ESP mooring. (d, e) Concentrations of particulate DMSP (DMSPp), dissolved DMSP (DMSPd) and DMSP carbon as a percent of phytoplankton carbon obtained from the Niskin collections. Dark gray boxes identify periods of uncoupled gene expression.

