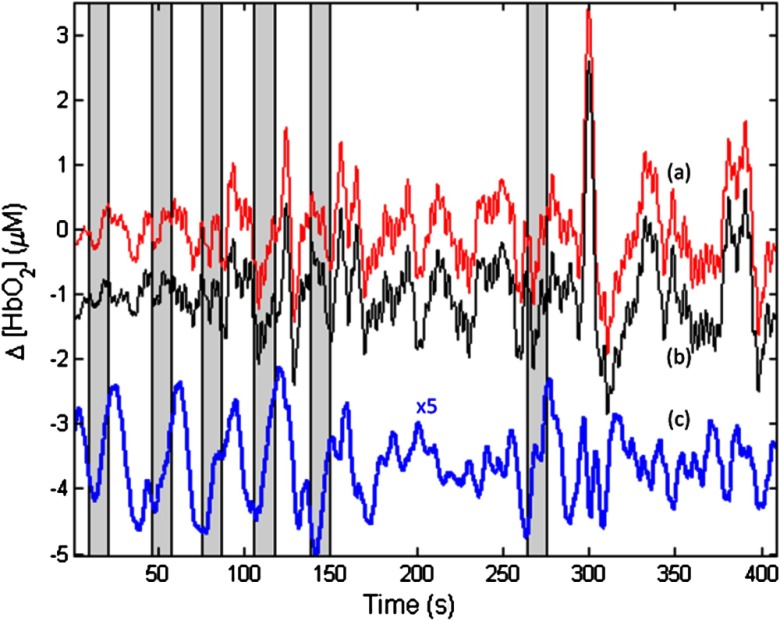
Fig. 7.
Oxyhemoglobin trends recorded using a 13-mm channel (a, red) and the corresponding 6-mm channel sharing the same source (b, black, scaled for least-squares fit). Gray bars indicate stimulation epochs. The residual of the fit (c, blue, magnified for clarity by a factor of 5) exhibits surges at the onset of each stimulation, suggesting that the 13-mm recording has significant sensitivity to stimulus-related hemodynamics.

