
Fig. 4.
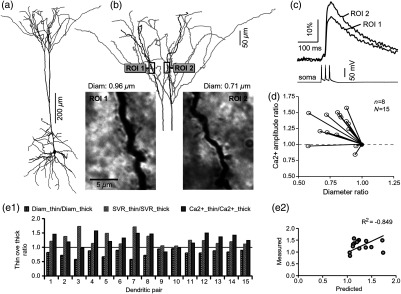
Thinner branches experience greater amplitudes. (a) A layer 5 pyramidal cell filled with OGB1, AF594, and biocytin was reconstructed after the calcium imaging session. (b) Upper: two dendrites (black) were in the same focal plane allowing simultaneous recordings. Lower: magnification lens used to measure dendritic diameters. (c) Current injections into the soma were used to initiate three APs with interspike interval of 20 ms. Simultaneous recordings of dendritic signals at two locations marked in (b). (d) Diameters of sister branches in each pair were normalized against the branch with greater diameter ( axis). signal amplitudes were normalized against the stronger branch in a pair ( axis). Sister branch pairs are connected by straight lines. Note that signal amplitudes were regularly greater in thinner branches. (e1) Each dendritic pair () is represented by three values: (i) diameter of thinner branch divided by diameter of thicker branch (dotted bar), (ii) calculated surface-to-volume ratio (SVR) of thinner branch divided by calculated SVR of thicker branch (light gray bar), and (iii) measured signal in thinner branch divided by signal in thicker branch (dark gray bar). Note that in sister branches with similar dendritic diameters (), as determined in dendritic pair #9 or dendritic pair #10, the AP-induced transients were very similar, too ( ). (e2) The measured value () is plotted against the predicted value () for each dendritic pair (). Linear regression (forced through zero) has a negative .