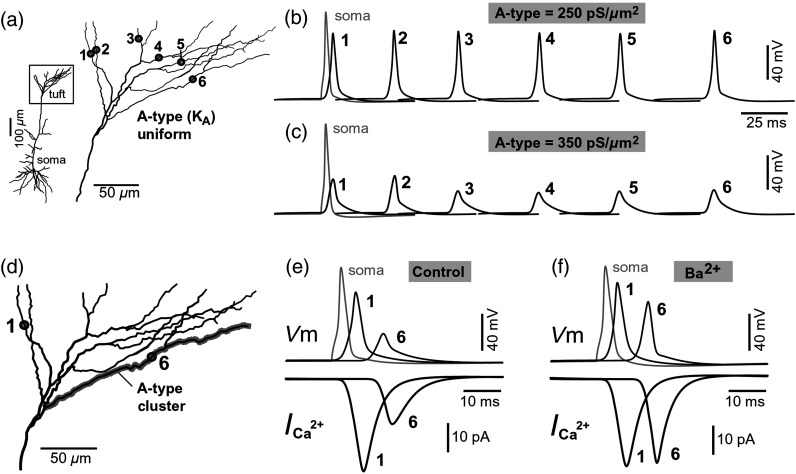
Fig. 5.
Modeling AP backpropagation in apical tuft dendrites. (a) Neurolucida reconstructed layer five pyramidal neuron from the rat medial prefrontal cortex (P28). Apical tuft arbor is enlarged with six recording locations (1 to 6) indicated by circles. Current injection into the soma was used to initiate an AP. Sample AP waveforms from the cell body (soma) and sister dendrites 1 to 6 are shown on the right at two levels of global uniform A-type conductance, (b) and (c) . (d) Apical tuft arbor with two recording locations 1 and 6. Global A-type conductance is . Gray highlight marks dendritic segments endowed with fivefold higher A-type conductance density than the rest of the apical tuft. Sample AP waveforms from the cell body (soma) and two sister dendrites (1 and 6) are shown before (e) and after (f) application of A-type channel blocker (). Calcium currents () in two sister branches are shown below the voltage () waveforms. and waveforms in sister branch “6” are shifted rightward for clarity. Note that a barium-induced partial block of the global and clustered A-type conductances (50% each) results in equalization of the signal in sister branches.

