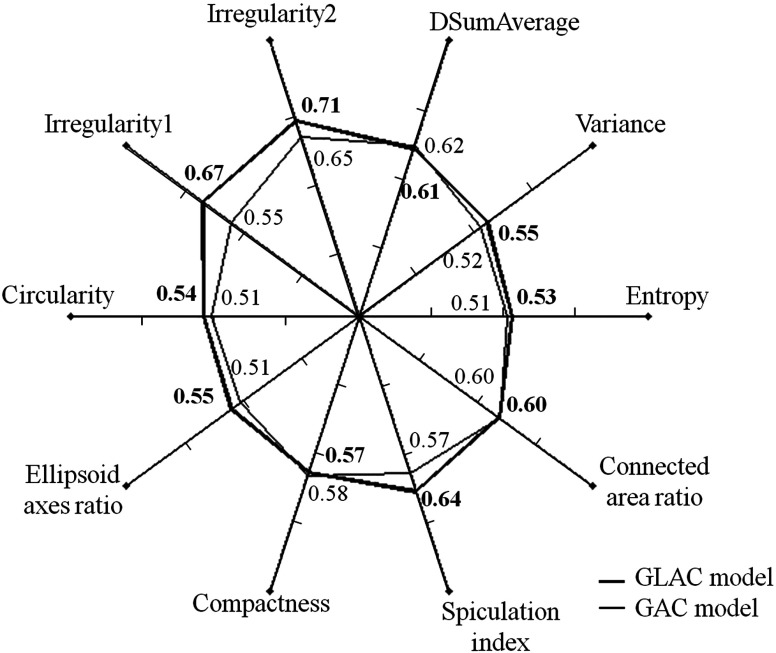
Fig. 2.
Spider plot depicting the classification performance for the task of distinguishing between cancerous and noncancerous lesions of selected computer-extracted lesion features in terms of AUC values when using the GAC and GLAC segmentation models (DSumAverage refers to the value difference of the texture feature “sum of average” between lesion and background).

