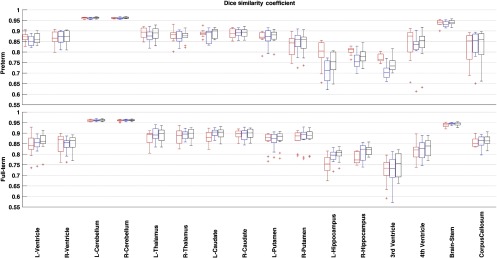
Fig. 6.

Dice similarity coefficient for the pediatric template library segmented with preterm born (red), full-term born (blue), and all (black) templates compared with the manual segmentation data. Segmentation conducted through the FS + LDDMM pipeline. [Box plot legend: median (midline), box (25th and 75th percentiles), and whiskers (extrema).]
