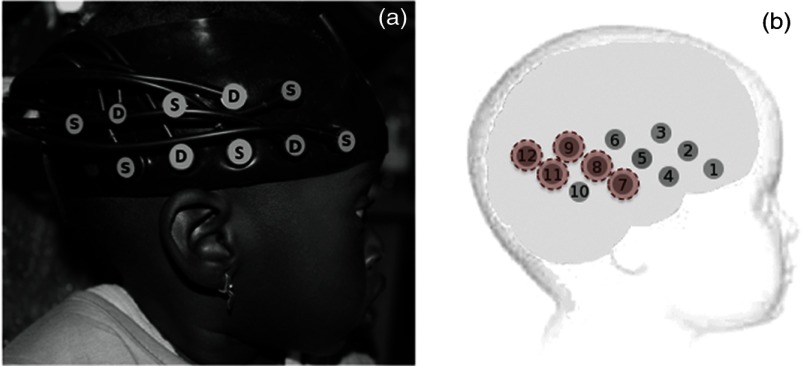
Fig. 1.
Near infrared spectroscopy (NIRS) sensor array used in the studies. (a) Participant wearing the headgear, showing the distribution of source (S) and detector (D) optodes. (b) Representation of the location of the channels; highlighted circles indicate channels included in the region of interest (ROI).

