Fig. 3.

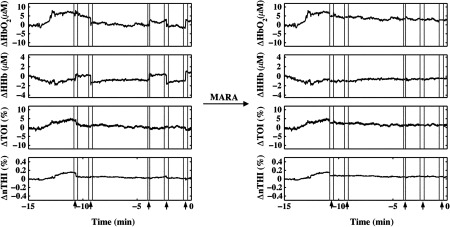
NIRS data from patient P7 before and after the application of MARA. The vertical lines and black arrows indicate the artifacts identified using MARA. Time zero represents seizure onset.

NIRS data from patient P7 before and after the application of MARA. The vertical lines and black arrows indicate the artifacts identified using MARA. Time zero represents seizure onset.