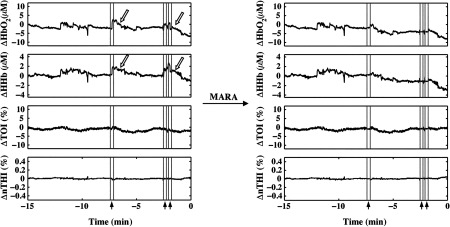
Fig. 4.

NIRS data from patient P8 before and after the application of MARA. The vertical lines and black arrows indicate the artifacts identified using MARA. Time zero represents seizure onset. White arrows indicate a gradual return to baseline following a sharp shift in the data.
